Our view at Stack - Pipedrive is a robust CRM platform, offering automation, contact data collection, webhooks, AI-powered sales assistant, email communications, email marketing, and customisable sales pipeline workflows.
Calculating sales mix helps your company determine the ratio of products or services it sells.
It’s a crucial exercise that helps you invest more resources and energy in the most profitable products and identify missed opportunities.
In this article, we’ll explain how to calculate, track and improve your sales mix simply and accurately to become more profitable.
What is sales mix?
For companies with multiple products, sales mix calculations determine the proportion of each product sold. Depending on your calculations, sales mix can help you determine the most to least profitable product and whether you sell enough of each to reach your sales targets.
If a company sells 100 units of Product A and 200 units of Product B, the basic sales mix is 33.33% of Product A and 66.67% of Product B. You could also say the sales mix ratio is 1:2.
Companies use sales mix as a tool to maximize profitability and ensure they allocate resources to the right products.
Suppose you run a B2B (business-to-business) model that sells five services. Sales mix calculations can help you determine:
-
How much revenue each service or product line brings in
-
How different actual sales were from budgeted estimations
-
How variable costs (e.g., materials or labor) have impacted sales
Using this information, you can understand whether you sell enough of each individual product or service to meet your revenue targets. You can also adjust your sales, marketing and pricing strategies to account for any disparities.
Recommended reading

9 revenue-boosting sales hacks from the experts
Why do companies need to understand their sales mix?
A company’s sales mix helps it understand which products or departments generate the most profit and whether its sales teams meet sales goals.
Every company has limited time to create, market and sell products, so making smart decisions and focusing on the right products can make you more money.
Let’s say you produce and sell two types of bespoke office furniture. You’re in a competitive market with only a small team, so you must optimize every hour.
Your two products are:
-
Product A: High-end ergonomic chairs designed for maximum comfort and support during long working hours
-
Product B: Customizable modular desks that customers can easily reconfigure for any space
Your ergonomic office chairs comprise 33% of your total sales mix and 45% of your revenue. Your more popular modular desks are 67% of your sales mix and 55% of your revenue.
Your ergonomic office chairs have a higher profit margin. However, they’re also more complex and time-intensive to make. Your modular desks have a lower production time per unit.
Calculating the sales mix shows that you don’t always need to sell more of your most expensive products to become more profitable. Instead, it can direct your sales team’s focus to the right products.
Sales mix information helps business owners and leaders visualize and more accurately assign future budgets and resources to products that positively impact their bottom line.

For larger businesses with expansive product lines, the number of units to sell to make a profit may constantly change depending on internal updates (e.g., product innovation) and external factors (e.g., seasonal trends).
Constant fluctuations like these make it even more crucial to assess your sales mix regularly, such as quarterly, to ensure accuracy. If you have a lot of products, you may need to calculate your sales mix monthly or even weekly.
Recommended reading

20 most important KPIs for sales teams to track
How to calculate sales mix to hit revenue goals
To calculate sales mix more accurately, you need to understand profit margins, contribution margins and positive and negative variance.
Let’s break down each of these calculations.
Note: Use the formulas below as a sales mix calculator to create benchmarks unique to your business that your sales team can work to improve on.
Profit margin formula
Before calculating the sales mix, you need to understand each product’s profit margin – each product’s profit divided by its sale price. After deducting costs from the sale, the final percentage represents what your company makes.
You can calculate profit margin with this formula:
(sale price − cost to company) ÷ sale price × 100 = profit margin
Here’s what that looks like in an example.
(100 − 20) ÷ 100 × 100 = 80% profit margin
Do this calculation for each of your products and compare your figures.
Recommended reading
Sales Calculator | Sales Tax Calculator
Suppose you sell five products, and Product C has the highest profit margin. In that case, you might set a target of selling 10 Product Cs across the team and five each of Product A, B, D and E.
Products with higher margins bring in more profit for your business, so selling more of those will mean a more profitable mix. You can compare your percentages here for a rough idea of your sales mix.
You can also take this process further to get deeper insights.
Sales mix formulas: volume and revenue
Once we know each product’s profit margin, we can lay out our metrics to calculate your volume and revenue sales mixes. Let’s revisit our bespoke office furniture example over a monthly period.
Note: When calculating sales mix, represent profit margin per unit in dollars instead of percentages for a clearer and more practical measure.
Here’s how you’d break down your numbers for Product A (the ergonomic chairs):
-
Product A: Ergonomic chairs
-
Profit margin: $50 per chair
-
Monthly sales volume: 100 units
-
Monthly revenue: 100 units × $50 = $5,000
Here’s how you’d lay out your metrics for Product B (the modular desks):
-
Product B: Modular desks
-
Profit margin: $30 per desk
-
Monthly sales volume: 200 units
-
Monthly revenue: 200 units × $30 = $6,000
Once you have your numbers for each product, you can calculate your overall volume and sales revenue.
-
Total monthly sales volume: 100 (chairs) + 200 (desks) = 300 units
-
Total monthly revenue: $5,000 (chairs) + $6,000 (desks) = $11,000
Using these metrics, you can work out your sales mix with the following formula:
(Unit sales of the product ÷ total unit sales of all products) × 100 = sales mix percentage
Ergonomic office chairs:
-
Sales mix (volume): (100 total chair sales volume ÷ 300 total sales volume) × 100 = 33.33%
-
Sales mix (revenue): ($5,000 total chair revenue ÷ $11,000 total revenue) × 100 = 45.45%
Modular desks:
-
Sales mix (volume): (200 total desk sales volume ÷ 300 total sales volume) × 100 = 66.67%
-
Sales mix (revenue): ($6,000 total desk revenue ÷ $11,000 total revenue) × 100 = 54.55%
Although modular desks have a lower profit margin, they’re also faster to make. Focusing on making and selling more units will allow you to maximize overall productivity and revenue.
Download Your Sales and Marketing Strategy Guide
Grow your business with our step-by-step guide (and template) for a combined sales and marketing strategy.
Sales mix variance formula
Sales mix variance is the difference between a company’s budgeted sales mix (the number of each product they aimed to sell) and its actual mix (the number of products they sold) at the end of a specific period.
Tracking what happened in the last period (e.g., month, quarter or custom time) allows you to compare your sales this period to see if you’re on track. If you’re behind on selling Products A and C and it’s already halfway through the period, you need to try some new sales and marketing tactics.
The variance will also let you see how close you are to hitting your targets and staying within budgets or whether you need to pivot.
Here’s the formula you need to calculate sales mix variance:
Number of actual units sold × (actual sales mix percentage − budgeted sales mix percentage) × profit margin per unit = sales mix variance
To work this out accurately, you’ll need two definitions:
-
Actual sales mix percentage. The actual units sold of a product divided by the total units sold over a set period.
-
Budgeted sales mix percentage. The planned units sold of a product divided by the total planned units sold over a set period.
Note: When calculating, always convert percentages to their decimal form (e.g., 50% becomes 0.5).
Let’s work out the variance for the lower-profit modular desks.
-
Actual sales mix percentage for modular desks: 66.67%
-
Budgeted sales mix percentage for modular desks: 50%
-
Profit margin per unit for modular desks: $30
-
Formula: 200 × (0.6667 − 0.50) × 30
-
Sales mix variance: $1,000.20
In this case, you get a positive number. However, it can often be negative.
Positive vs. unfavorable sales mix variance
A positive sales mix variance means the actual sales mix of products has led to higher overall profitability than what you budgeted or anticipated.
For example, you may budget to sell 50% of Product A and 50% of Product B. However, you end up selling 60% of Product A and 40% of Product B.
If Product A has a higher profit margin, you’ll have a positive sales mix variance. If Product A has a lower profit margin, you can get a negative (or unfavorable) sales mix variance. In this case, your actual sales mix contributed less to the overall profit you planned for.
For example, the office chairs (with the higher profit margin) result in an unfavorable variance.
-
Actual sales mix percentage for ergonomic office chairs: 33.33%
-
Budgeted sales mix percentage for office chairs: 50%
-
Profit margin per unit for office chairs: $50
-
Formula: 100 × (0.3333 − 0.50) × 50
-
Sales mix variance: −$833.5
A negative mix variance tells you when a product is underperforming. Using this knowledge, you can assess whether you need to market it better, adjust its price, improve its features or even discontinue it.
Contribution margin vs. sales mix contribution margin
Contribution margins are the differences between sale prices and each product’s variable costs (e.g., materials or labor). Working this out helps businesses understand how different products or services contribute to overall profitability.
Calculating these margins also suggests how much budget a business has to cover fixed costs (e.g., salaries) to break even or generate profit.
Sales mix contribution margins (or “weighted contribution margins”) determine how the company product mix contributes to overall profitability.
To calculate the sales mix contribution margin, you must first determine each product’s contribution margin and then multiply it by its sales mix percentage.
(Product sale price − product variable costs) = contribution margin
Let’s say you sell 100 of your bespoke office products in a month. Each chair costs $500, and its variable costs are $250, while each desk is $200 with $50 in variable costs:
Using the sales mix percentages we previously identified, we can calculate the sales mix contribution margin with the following formula:
Sales mix percentage x contribution margin per unit = sales mix contribution margin
In that case, the breakdown of your sales mix contribution looks like this:
Even though ergonomic chairs have a higher individual contribution margin ($250), the larger volume of modular desks sold (67 units) balances things out.
Using this information, you may try to increase chair sales (with their higher profit potential) or explore ways to reduce variable costs for modular desks to further improve their contribution margin.
Note: Variable costs can change often, so it’s important to regularly calculate sales mix contribution margins to account for any discrepancies.
How to keep track of your sales mix
Calculating your sales mix helps you understand which products you need to sell more to maximize profit. Once you have those numbers, you can track your progress toward them using a customer relationship management (CRM) tool.
Let’s say you’ve worked out your ideal sales mix for your software-as-a-service (SaaS) product this month. You realize you need to sell the following to hit your revenue goals:
-
Eight Silver plans
-
Five Gold plans
-
Three Diamond plans
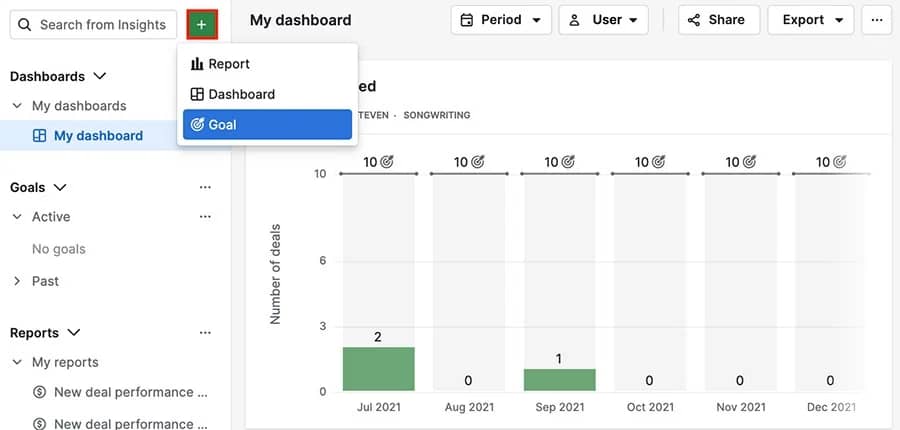
Business owners and sales managers can use a CRM system like Pipedrive to track the number of deals on this journey.
The Goals feature, in particular, can help you visualize your team’s progress toward the sales targets you set.

Using a CRM for this means you can optimize your sales and marketing strategies to hit the number of plans you need for an ideal sales mix. It can also help you calculate variance at the end of a period to make better strategic decisions for the next.
Note: You can use a simple Excel spreadsheet to track your sales mix, but you’ll miss out on the helpful features of a dedicated tool.
How to improve your sales mix
Now you’ve learned how to find your sales mix, you can use the figures as benchmarks and work to improve them.
Sometimes, this process involves adjusting your current products, selling price or strategy. On other occasions, it may involve creating something completely new.
Whatever your products or industry, here are six ideas for improving your sales mix and total revenue:
-
Offer suggested “add-ons” with higher profit margins when your business sells to a customer
-
Focus your marketing efforts on promoting the products that positively impact your sales mix
-
Create new products or services that have higher profit margins or lower production time
-
Work on lowering variable costs to improve each product’s contribution margin
-
Re-assess low-profit items to pinpoint where you could make more money
-
Shift your sales strategy to sell more products with a higher contribution margin
For example, you can use Pipedrive’s email marketing software to create carefully crafted campaigns that benefit your sales mix. You can also easily track their success with notifications alerting you to any engagement.

Let’s say you realize you need to sell two more of your Professional plans this week to meet your budgeted sales mix. You could promote them to those on your email list who have shown an interest in the past.
You can even customize the platform’s email templates to optimize your time to focus on higher-priority tasks, like selling on other platforms.
Recommended reading

7 email strategy and email marketing tips to know in 2024
Final thoughts
Sales mix plays a vital role in increasing a company’s profitability. Calculating it consistently is crucial to keep up with consumers’ ever-changing buying behavior.
Once you have accurate data, you can alter your sales and marketing strategies to achieve your preferred outcome (e.g., selling more of a profitable product).
To track and positively impact your progress on this journey, use Pipedrive’s sales CRM. Sign up for the 14-day free trial and start selling more products that’ll help you hit your revenue goals.
If Pipedrive is of interest and you'd like more information, please do make contact or take a look in more detail here.
Credit: Original article published here.
