Our view at Stack - Pipedrive is a robust CRM platform, offering automation, contact data collection, webhooks, AI-powered sales assistant, email communications, email marketing, and customisable sales pipeline workflows.
It takes more than raw data to make informed strategic decisions. Running a successful team or company requires tools to turn that data into actionable insights.
Reporting tools help businesses gauge and optimize performance in areas like sales, marketing and finance.
In this article, you’ll learn which tools deliver the most valuable insights and how to build the perfect reporting toolkit for your organization.
What are reporting tools? The different types explained
Reporting tools are apps that collect, analyze and present data to help you make informed decisions. There are various types of tools for reporting on different metrics.
If you’re building up your toolkit from scratch, consider the following reporting software:
-
Sales reporting tools to track and analyze sales data and provide insights into team performance, customer behavior and revenue. They can help you identify your top-performing products, forecast future sales and optimize your sales cycle.
-
Marketing reporting tools measure the performance of email, social media and online ad campaigns. They track conversion rates, customer engagement and ROI metrics, helping you refine your strategies for better results.
-
Website analytics tools track website traffic, user behavior and site performance to show how your online presence contributes to business goals. They focus on metrics such as page views, bounce rates, traffic sources and user demographics.
-
Financial reporting tools present your business’s financial information, including income statements, balance sheets and cash flow statements. They offer helpful insights into your financial health, enabling you to make informed decisions about budgeting and investments.
Some businesses also benefit from business intelligence (BI) tools, which collate data from multiple sources. These tools offer advanced analytics to provide a more granular performance view.
However, many BI tools are more sophisticated, making them better suited to enterprise users and less relevant to smaller companies just starting with reporting. According to CIO, the overall BI adoption rate is 26% compared to 80% in organizations with over 5,000 employees.
Recommended reading

Everything you need to know about small business management
6 of the best reporting tools for your tech stack
Knowing which types of reporting software to buy is just one step. You’ll also need to navigate a busy market of vendors promising big results. Choosing the right solutions can be tough.
To help, we’ve compiled six of the best reporting tools for small business users based on factors like cost, user-friendliness, pricing and integration potential.
1. Best for sales reporting: Pipedrive
Pipedrive is a cloud-based customer relationship management (CRM) system designed specifically for sales teams.
The easy-to-use software offers powerful sales reporting features for monitoring performance metrics, sales activities and team effectiveness. It presents sales data from user input, third-party integrations and automations in clear reports and dashboards like this:
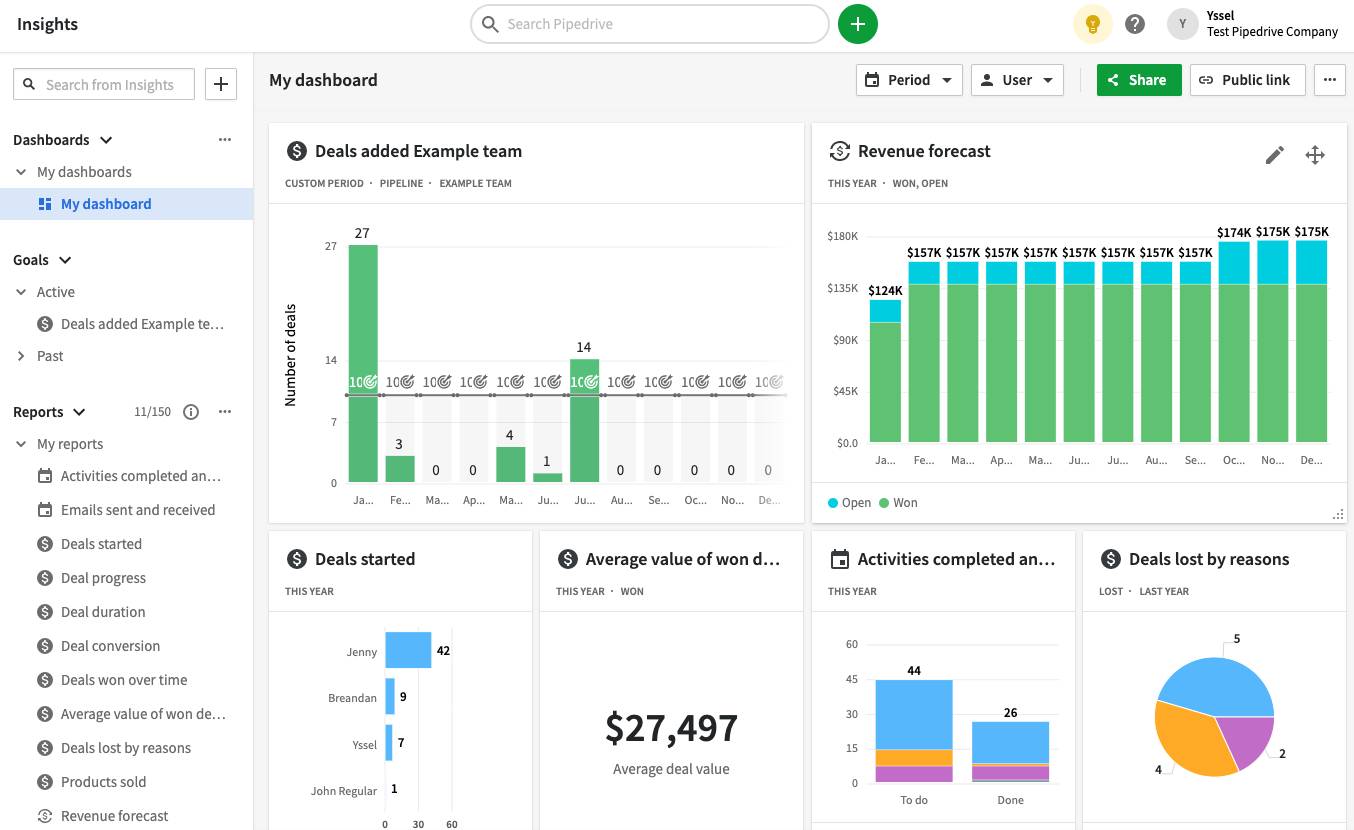
Pipedrive’s reporting features are fully customizable, allowing you to closely monitor the metrics most relevant to your sales objectives (i.e., your sales key performance indicators, or KPIs).
Consider these use cases, for example:
-
Track the number of deals closed within a specific period to ensure your team is on track to meet targets
-
Analyze the conversion rate at each stage of the sales pipeline to identify common drop-off points
-
Recognize your team’s top performers and apply their successful techniques more broadly
Pipedrive’s integrations mean you can incorporate data from common business applications in your reporting.
You can pull information from lead-generation tools, project management systems, email marketing software and more. It’s also easy to import sales data from Microsoft Excel and Google Sheets.
| Key features | Sales pipeline view, clear data visualization, interactive dashboards, custom reports, workflow automation. |
| Starting cost |
$14 per user per month (billed annually). Pipedrive’s free trial makes it easy to test out the software’s reporting functionality without any commitment. |
| Why Pipedrive is great |
Pipedrive’s award-winning user-friendliness makes it a fantastic choice for small business owners, managers and sales leaders with limited data analysis experience. |
2. Best for marketing analytics reporting: Reportei
Reportei is an all-in-one marketing analytics tool for small businesses and agencies.
The software offers straightforward marketing reports on various metrics to help you measure social media performance, website traffic and campaign effectiveness from a single location.
Reportei’s data comes from connections to major platforms like Facebook, Instagram, Google Analytics and Google Ads.
Here’s how the application shows data from Facebook:
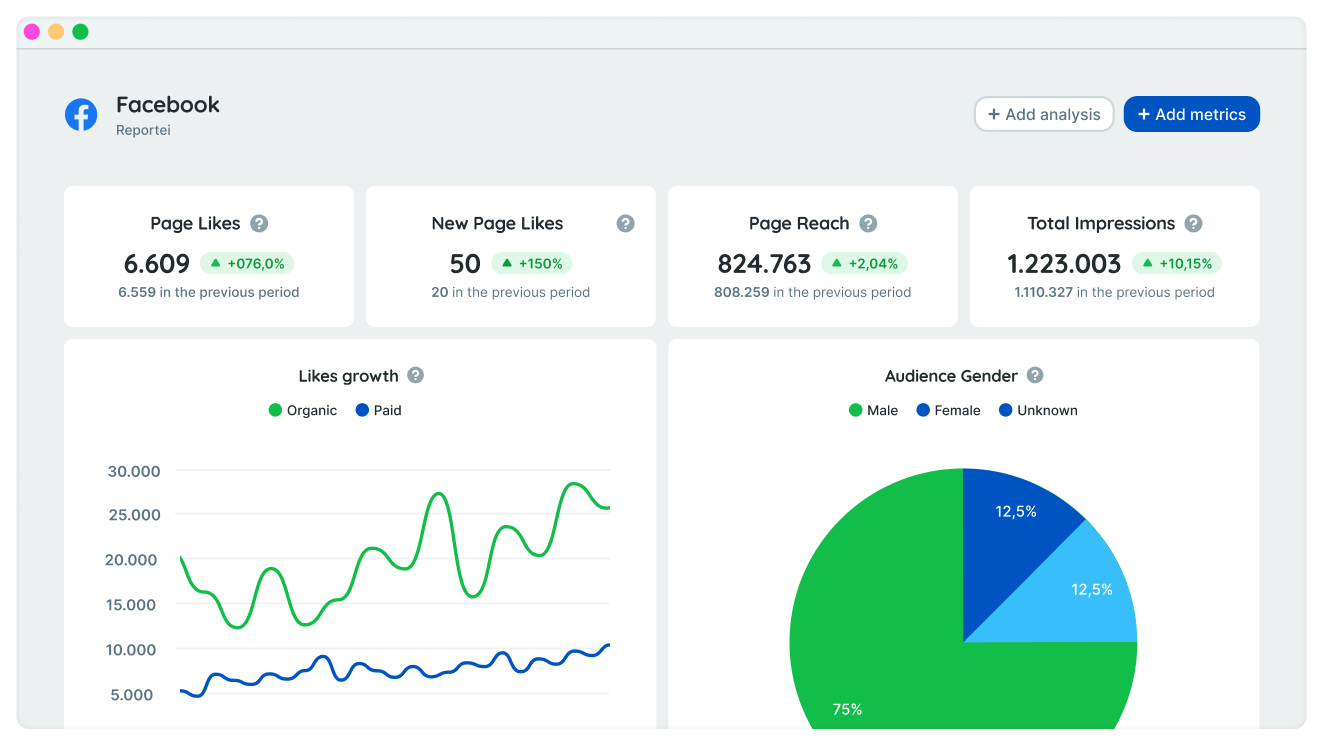
Connecting Reportei to Pipedrive lets you see how your marketing contributes to sales goals. The integration brings sales and lead-gen data into one interface to reduce app fatigue (the mental strain of switching between different tools), which is proven to slow productivity.
| Key features | Social media reporting, CRM integration, AI-generated reports, customizable templates, PDF export. |
| Starting cost | $24 per month. Free trial available. |
| Why Reportei is great | Reportei pulls data from many popular marketing and analytics platforms, making it ideal for small businesses using various digital marketing tools. |
3. Best for email analytics reporting: Campaigns
Campaigns is a powerful email marketing tool add-on to Pipedrive’s CRM system.
Designed to help businesses easily build, send and measure email campaigns, the user-friendly software pulls customer data straight from your CRM to streamline marketing workflows.
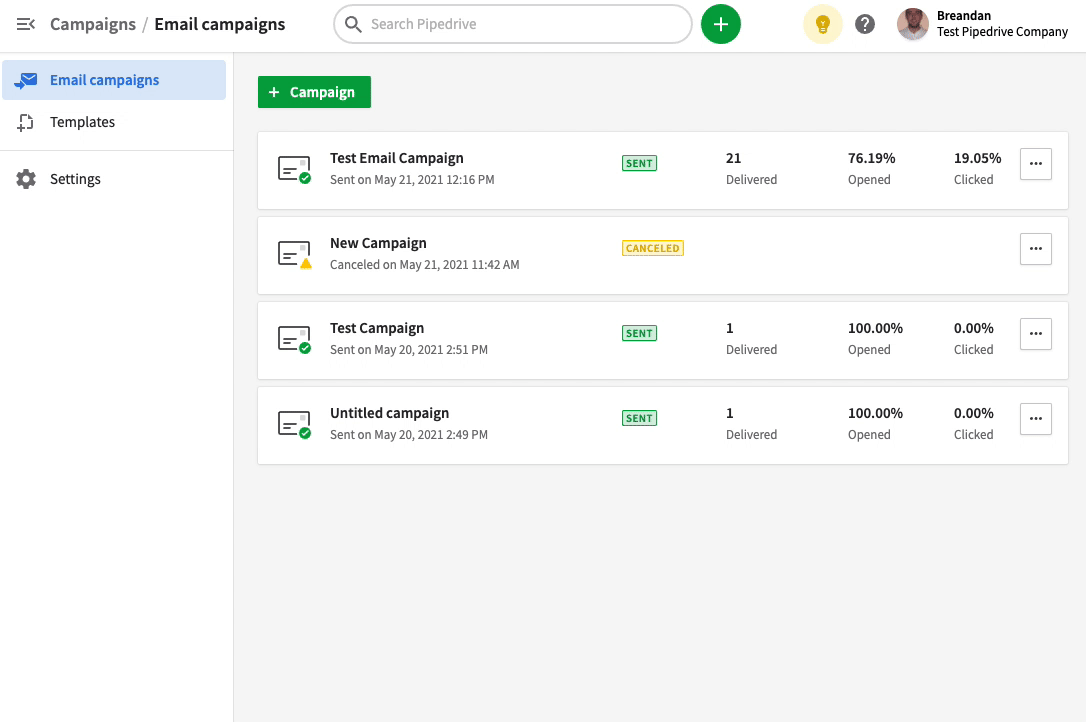
Campaigns boasts interactive reports and dashboards containing real-time data on campaign effectiveness. These data analytics tools can track key performance indicators such as:
-
Email delivery status. Whether emails reach recipients’ inboxes or bounce back
-
Open rates. The percentage of delivered emails that recipients opened
-
Link performance. How often recipients click on links in the emails you send
-
Unsubscribe rates. The percentage of recipients who opt out of receiving future emails
These metrics and more can help you make data-driven decisions on your email marketing strategy.
For example, if open rates for your latest campaign are lower than average, you might test new subject lines to grab readers’ attention.
| Key features |
CRM data integration, intuitive drag-and-drop email builder, market segmentation, marketing automation |
| Starting cost |
Pricing available in the Pipedrive app to existing customers. New users can add Campaigns to their free trial. |
| Why Campaigns is great |
Campaigns lets you manage your email marketing efforts within your sales software, making it easier to track the impact of email campaigns on lead generation and conversions. |
4. Best for website analytics reporting: Google Analytics 4
Google Analytics 4 (or GA4) is the go-to website reporting tool for many businesses.
It offers comprehensive insights into web traffic, user behavior and conversion rates, showing companies how visitors interact with their sales content and which pages perform best.
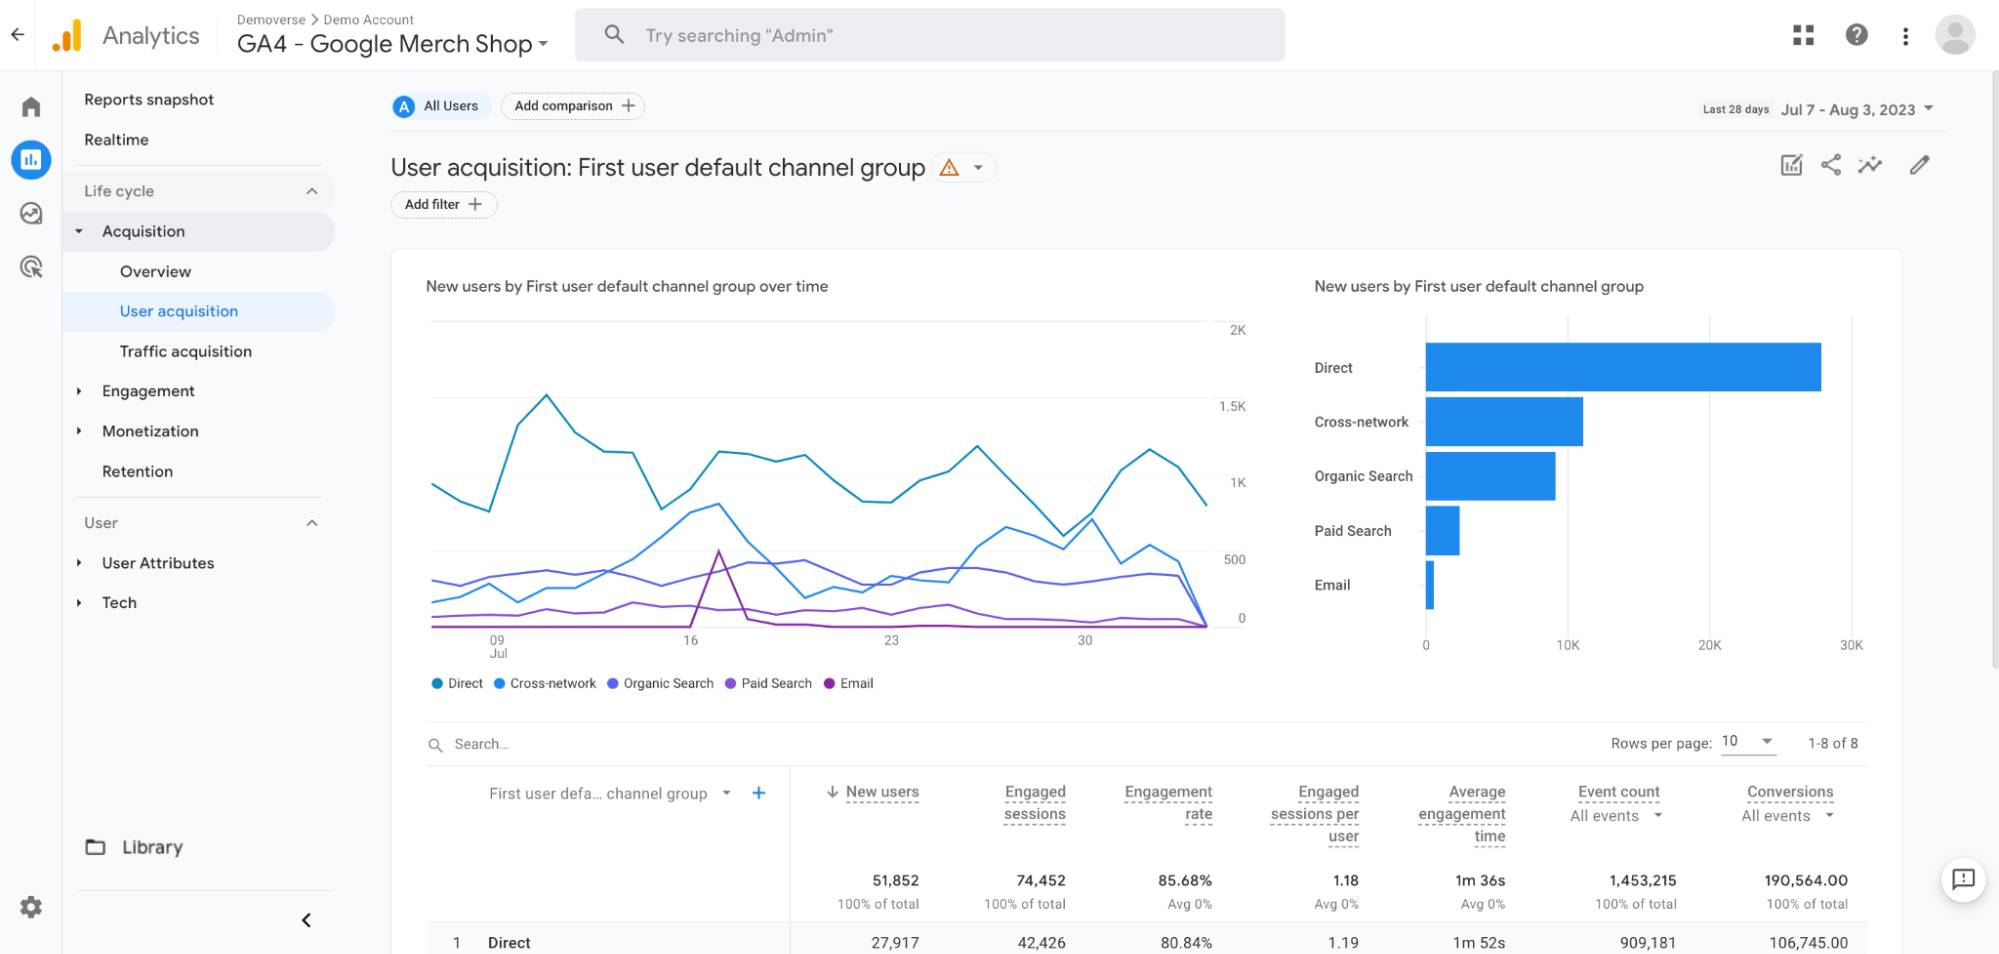
Google Analytics reports on everything from page views and users’ average time on page to visitor demographics and device types. You can use this information to make your website easier to navigate and more engaging for your target audience.
Connecting Pipedrive to GA4 using the Google Analytics Connector app lets you track and analyze the entire customer journey. It links website behaviors to sales outcomes so you can learn which activities return revenue.
| Key features | Traffic analysis, conversion tracking, user behavior reports, Google Ads integration |
| Starting cost | Free |
| Why Google Analytics is great |
GA4 is one of the most comprehensive website analytics tools yet it’s easy to use after some learning. It’s also completely free |
5. Best for financial reporting: QuickBooks
QuickBooks is a popular accounting software that offers robust financial reporting features.
The app helps small businesses manage their finances by generating:
-
Industry-standard reports such as profit and loss statements, balance sheets and cash flow statements – useful for updating stakeholders and preparing tax returns
-
General snapshots of financial performance (live or for a specific period), which you can customize to include your KPIs and use to inform strategic decisions
Here’s what a live reporting dashboard looks like in QuickBooks:
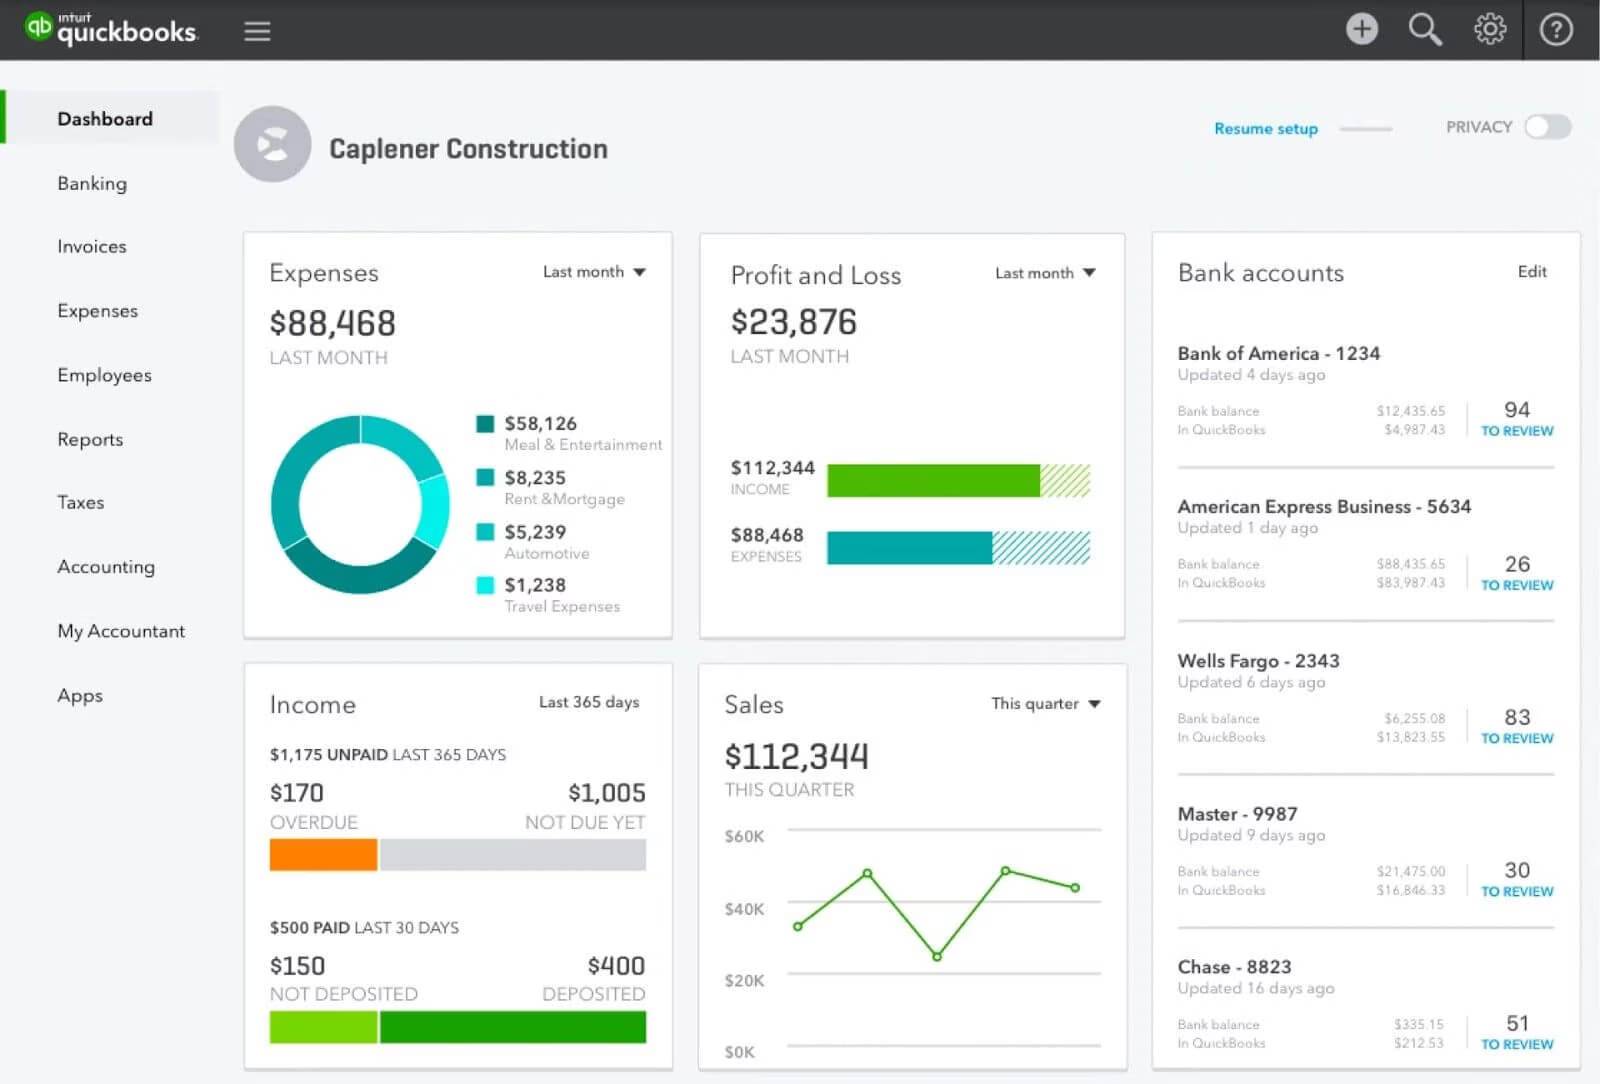
QuickBooks presents your financial data in clear charts and graphs to help you understand your business’s current position and future direction.
Check high-level metrics like sales and spending for a simple view of performance. You can also drill down into details like expense categories and overdue invoices to find streamlining opportunities.
QuickBooks gets its data from user input, banking integrations and connectivity to sales tools.
The Pipedrive-QuickBooks integration lets you create and issue invoices from within the Pipedrive interface, saving time for your accounting team.
| Key features | Financial data reporting (with report templates), invoicing, inventory management, payroll, banking and sales integrations. |
| Starting cost | $35 per month (billed monthly). Free trial available. |
| Why QuickBooks is great | QuickBooks’ simple interface makes large volumes of financial data easily digestible for business owners with limited accounting experience. |
6. Best for business intelligence reporting: ClicData
Business intelligence software might be more popular among larger organizations but it can still be helpful for fast-growing companies that need to wrangle many different datasets.
ClicData is a BI reporting solution that promises to “turn messy data into useful data”. It can aggregate information from more than 250 data sources, including Pipedrive.
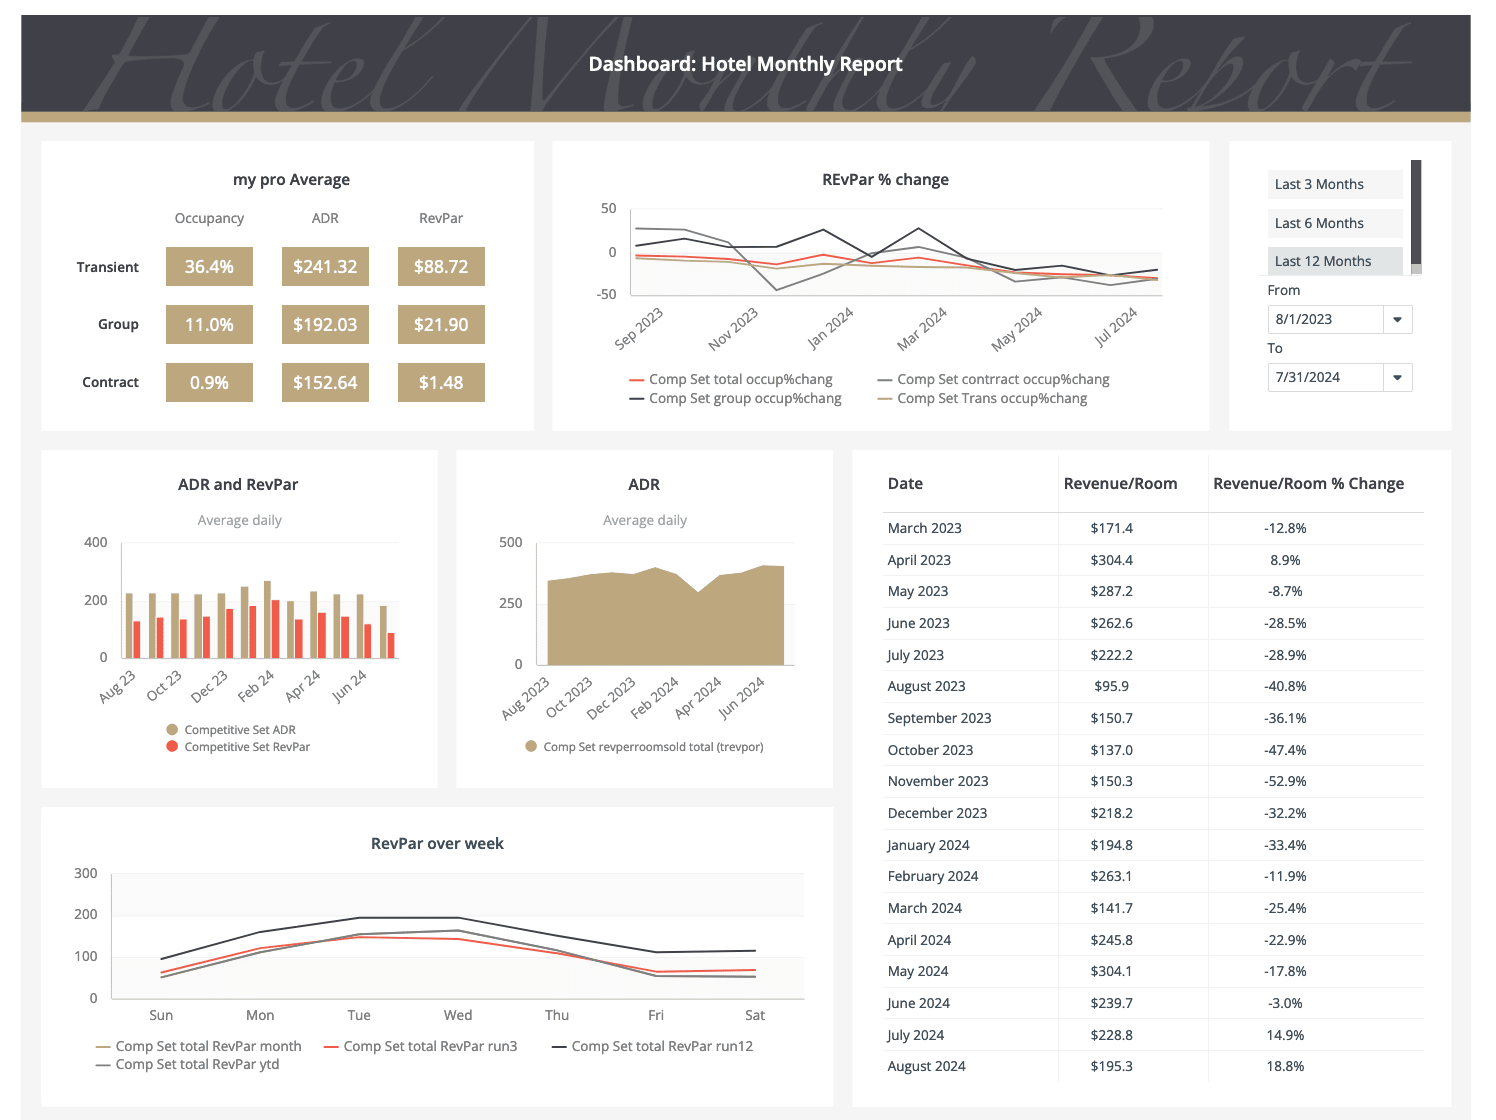
Other useful ClicData integrations include:
-
Cloud storage platforms like OneDrive, Google Drive and DropBox
-
Website and social media analytics tools like Google Analytics, TikTok and Bing Ads
-
Enterprise applications such as QuickBooks, ServiceNow and SAP (ERP)
-
Email clients for automatically processing data from attachments, including CSV, XLS (spreadsheet formats) and ZIP files
After connecting your data sources, you can easily build reports and dashboards to show the metrics that matter most to your business. There are simple drag-and-drop dashboard and report designers, and more than 70 visualization widgets.
| Key features | Report and dashboard designers, PDF export, parameterization (for filtering data by user/team), predictive analytics. |
| Starting cost | $275 per month (billed annually). Free trial available. |
| Why ClicData is great |
ClicData’s intuitive visualization tools and straightforward connectors are big selling points for business owners using a business intelligence tool for the first time. |
What to look for in small business reporting tools
Our list above contains six of the best reporting tools for small business owners. If you want to expand your search and look at other solutions, prioritize the following characteristics.
Ease of use
Your reporting tool should have an intuitive interface that is easy to navigate, even for users with limited technical expertise.
Reporting platforms that are easy to set up and use help ensure all team members can quickly adopt and use the software. Earlier adoption means your company benefits sooner.
For example, Pipedrive’s CRM has a clear, user-friendly dashboard that lets you drag and drop deals through various sales pipeline stages. Without the need for training, you can spend more time learning from your data and less time processing it.
Customization
Look for tools that enable you to customize reports to suit your business needs.
At the very least, you’ll want the ability to choose which metrics show in your reports. Otherwise, you’ll focus on the wrong data and your decision-making won’t improve.
For example, if your objective is to improve conversion rates, putting “deals closed” front and center on a sales reporting dashboard will help you track progress. If generating more leads is the target, you might prioritize “new deals” instead.
Other customization options include update frequency, reporting period and filtering (e.g., by sales rep or deal type in a sales tool). These features ensure you’ll always see the data most relevant to your goals.
Flexibility
The best reporting tools are adaptable to changing business needs. They make it easy to scale up or down as your company evolves or add capabilities to support new objectives.
Types of flexibility to look out for include:
-
A range of pricing plans to suit different budgets
-
The freedom to change or cancel your subscription
-
Plenty of customization options
-
Reliable integrations and add-ons
-
Frequent software updates to add new functionality
For example, all of the tools in our list are cloud-based applications with tiered pricing options.

Instead of investing heavily in on-premise hardware and long-term contracts, you can subscribe to any of the tools month by month to ensure you get your desired results.
Security
Reporting and analytics tools are goldmines of valuable and sensitive business information, so ensure yours has the security features to prevent unauthorized access. Otherwise, you risk reputational damage and costly legal action.
The best reporting solutions:
For example, user permissions let you restrict access to sensitive data based on roles within your organization. It means that only authorized employees can view or modify certain data.
Meanwhile, two-factor authentication (2FA) adds another protective layer by requiring users to verify their identity via SMS, email or an authentication app, in addition to their password.
Support
You’ll want a team of experts on hand to answer questions quickly so that minor issues can’t become major bottlenecks.
The main factors to consider are channels and response times:
-
A range of channels ensures your team can get help at their convenience rather than using methods they’re uncomfortable with or lack easy access to
-
Response times are key to maintaining productivity. The sooner you can overcome problems, the sooner you can keep working.
Self-service support channels are also helpful as you can learn from them in your own time. Look out for comprehensive knowledge bases, helpful chatbots and active user communities.
Mobile access
Mobile reporting apps allow you to analyze data on the move.
Although large screens will always show more detail, you should still be able to access and share your reports on smaller devices.
Most of the solutions in our list have mobile equivalents to their desktop apps for both iOS and Android devices. For example, here’s what ClicData’s mobile interface looks like:
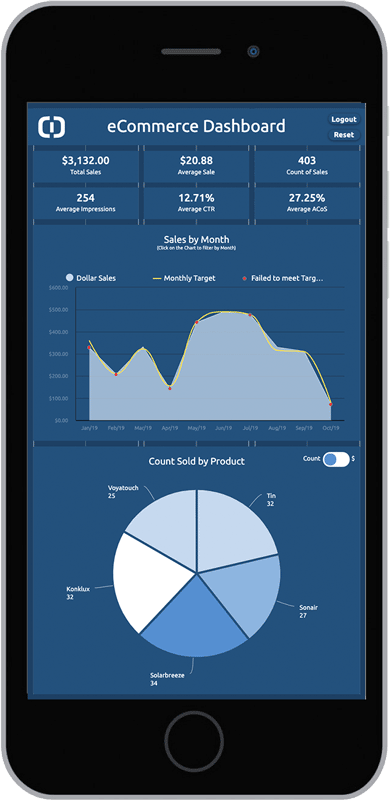
If you have a reporting app in mind, check that you can test its iOS and Android mobile apps on a trial basis and ensure they work on all of your team’s devices.
Recommended reading

Remote Selling: How to manage a sales team remotely
Final thoughts
Collecting and making sense of the right data gives your business an edge over less thoughtful competitors.
There are now more tools than ever that can help you generate helpful insights. Some of these, including Pipedrive, even automate the process to save time and stress.
Start by laying out your objectives. Once you know what you want to measure, you’re ready to find the best solution to help you achieve it.
Download Your Guide to Sales Performance Measurement
The must-read guide for any sales manager trying to track, forecast and minimize risk. Learn how to scale sales with data-backed decisions.
If Pipedrive is of interest and you'd like more information, please do make contact or take a look in more detail here.
Credit: Original article published here.
