A software company increases plan pricing by 10% and sign-ups stay steady. A supplier does the same to its next-day delivery rates, and orders drop fast. Why does that happen?
The price elasticity of demand (PED) explains why matching price changes have different results in different scenarios. It’s also a reliable way for small businesses to test pricing strategies and plan promotions.
This guide shows how price elasticity works, including how to calculate and apply it to business decisions. You’ll also learn how to track the impact in your sales software.
What is the price elasticity of demand (and why does it matter in a small business)?
The price elasticity of demand measures how much customer demand changes when you adjust your prices. It’s like a “price sensitivity meter” for your products.
If demand barely moves after a price change, it’s called inelastic.
If demand changes a lot, it’s elastic.
Here’s a simple example:
|
Inelastic demand |
Elastic demand |
|
When coffee shops put latte prices up, most customers still buy their morning cup because it feels essential to them and is still very affordable. |
A small price jump in luxury watches causes demand to drop as customers can wait or find cheaper alternatives. Unlike coffee, it’s a significant purchase. |
Both types of price elasticity of demand apply in B2B sales. Customers will likely accept a small price change if your specialist product is deeply tied to users’ daily operations, like accounting software. That’s an example of inelastic demand.
A small price jump could push customers to switch providers if you sell a less critical tool with many cheaper alternatives, like a generative AI app. That’s an example of elastic demand.
Whatever the context, elasticity follows the same formula:
Price Elasticity of Demand (PED) = % change in quantity demanded ÷ % change in price
We’ll explain this method in more detail shortly, with some examples.
What price elasticity means for SMB sales and marketing teams
Pricing mistakes can be costly for small and budget-conscious businesses. Understanding price elasticity helps them make informed decisions about how much to charge for products daily and during sales promotions.
This practice helps SMBs avoid expensive errors that slow or halt growth, like chasing overly price-sensitive leads when inelastic products bring better margins.
When you know how customers are likely to respond to cost increases, you maximize profitability by charging as much as they’re happy to pay without risking a drop in demand or driving people away to cheaper competitors.
Both sales and marketing teams benefit from knowing how elasticity affects their products and audience segments:
-
Salespeople can spot price-sensitive leads, recommend the right products and avoid over-discounting, which leads to better margins and more confident sales pitches
-
Marketers can decide which products to discount, when to push bundles and how to tailor offers based on buyer behavior
For example, if you know certain products have inelastic demand, focus on generating as much interest as possible rather than offering unnecessary discounts that cost your small business.
If a product has elastic demand, highlight lower costs or unique value-adds (like extra features or support) in pitches and content to convince price-sensitive customers to convert.
Note: Elasticity can vary between customer segments. The exact percentage change might not impact one group but significantly impact another. That’s why you must track how different audiences respond to changes and then tweak pricing or messaging accordingly.
How to calculate price elasticity of demand (the easy way)
This simple formula for calculating PED works for any product in any industry:
Price elasticity of demand = (% change in quantity demanded) / (% change in price)
Here’s a quick to show how it works:
You sell software-as-a-service (SaaS) at $50/month and usually get 200 monthly sign-ups. After a $10 price rise, monthly sign-ups drop to 160.
How to calculate PED:
-
Find the percentage change in price
(60 − 50) ÷ 50 = 0.2, or a 20% increase
2. Find the percentage change in quantity demanded
(160 − 200) ÷ 200 = −0.2, or a 20% decrease
3. Divide the change in demand by the change in price
(−20% ÷ 20%) = −1
Economists usually drop the minus sign to get the absolute value. What matters most is how significant the demand shift is, not whether it went up or down. So, the −1 above is a price elasticity of demand of 1.
This PED value of 1 is called unit elastic demand. The price increase offsets the sign-up drop, so total revenue stays the same.
Each result tells you something different about how customers respond:
|
PED value and demand type |
What it means |
|
0 – perfectly inelastic demand |
Demand doesn’t change, whatever the price Example: Critical medicines that have no close substitutes |
|
Less than 1 – inelastic demand |
Small change in demand when prices change Example: Everyday essentials like soap or gasoline |
|
1 – unitary elasticity |
Demand changes proportionally with price (revenue stays the same even if demand drops) Example: Our SaaS product above |
|
More than 1 – elastic demand |
Higher prices bring demand down Example: Luxury goods with a high availability of substitutes, like vacation packages |
|
∞ (infinity) – perfectly elastic demand (also called “PED”) |
Customers switch immediately when prices rise Example: Commodities in highly competitive markets, like oil or currency exchange |
That basic formula works fine for small changes. It’s super quick and easy to apply. However, when prices or demand shift by more than about 10%, the midpoint method is more accurate.
This method compares changes using the average of the old and new numbers, not just the starting point. It works like this:
% change = (new − old) ÷ average of old and new
For example, if the price goes from $50 to $60 and sign-ups drop from 200 to 160, the midpoint method gives a PED of 1.22. That’s a bit more elastic than the earlier result of 1.
It’s a slight difference that can affect how you interpret and act on the outcome.
Recommended reading

20 most important KPIs for sales teams to track
What affects the price elasticity of demand?
Price elasticity isn’t fixed. Many factors influence how customers respond to price changes, and the same product might be elastic in one context and inelastic in another.
These factors offer a practical lens for spotting where pricing flexibility exists and doesn’t, so you can use your limited time wisely and focus your efforts where they’ll have the most impact.
Here they are in more detail:
|
Factor |
How it works |
|
Necessity vs. luxury |
Essential products and services are generally more price inelastic because customers need them regardless of cost. Luxury items are more elastic for the opposite reason: customers can easily skip or delay their purchases without negatively impacting their lives. B2B example: accounting software for payroll (inelastic) vs. a premium add-on for polishing sales proposals (elastic). |
|
Availability of substitutes |
The more options customers have, the more price elasticity. If there are many close substitutes, even tiny price increases can push customers to competitors. Unique products have more inelastic demand because they’re harder to replace. B2B example: proprietary sales analytics tool with industry-specific datapoints (inelastic) vs. project management software (elastic). |
|
Brand loyalty and cost of switching |
Strong brands have less elastic demand because customers value their unique benefits. Tight marketing budgets make it harder for SMBs to build loyalty than larger competitors, so demand may be more sensitive to price changes. High switching costs also reduce elasticity. The costs could be financial (e.g., paying for new hardware) or time-based (e.g., learning new interfaces). B2B example: Long-term Pipedrive users with unique workflows (inelastic) vs. first-time customer relationship management (CRM) software buyers comparing options (elastic). |
|
Income proportion |
Expensive purchases relative to customer income are more elastic because buyers can afford to spend a little more without affecting their quality of life. For instance, 10% of $5 is only 50c, whereas the same percentage of $50,000 is $5,000, which is around a month’s earnings for the average American and therefore more impactful. B2B example: A 10% price increase on office coffee subscription (inelastic) vs. 10% increase on a custom software build (elastic). |
|
Period |
Demand can become more elastic as customers learn about alternatives or change their habits. Short-term demand may be inelastic, while long-term demand becomes elastic. B2B example: a SaaS renewal offer after a sudden price rise (short-term, inelastic) vs. customers switching platforms after six months (long-term, elastic). |
These factors often overlap and shape your customers’ sensitivity to price changes.
Before you make any rash increases, ask yourself these five questions:
-
Is your product essential or a luxury?
-
How many close substitutes exist?
-
How strong is your brand differentiation?
-
What percentage of customer income does your product represent?
-
Are you analyzing short-term or long-term demand?
The more factors suggesting inelastic demand, the more room you have to adjust pricing without losing customers.
Recommended reading

What is brand positioning: The ultimate guide with 4 examples
4 small business tactics for applying elasticity insights (with examples)
Tracking the price elasticity of demand for your products is just the first step. Now, you need to put what you learn to good business use.
Here are four simple ways to use PED insights to close deals and generate more revenue.
1. Limited-time discounts for elastic products
Temporarily reduce pricing on products with elastic demand to boost sales quickly.
Creating a cheaper option in a competitive market generates new interest, even if it’s just for a week or two. You may also push some hesitant buyers who already know about your brand into finally making a decision.
Fast, discount-based promotions like this are called flash sales. They’re helpful in SMBs as they create urgency without the significant marketing spend of an ongoing campaign.
Flash sales are particularly effective in these situations:
-
Introducing a new product or feature (i.e., building interest)
-
Clearing extra inventory (e.g., at the end of a longer promotion or ahead of a product update)
-
Filling slow sales periods (e.g., out-of-season travel tickets)
Whatever the reason, promote one-off discounts through email and social media, like Designmodo did here:
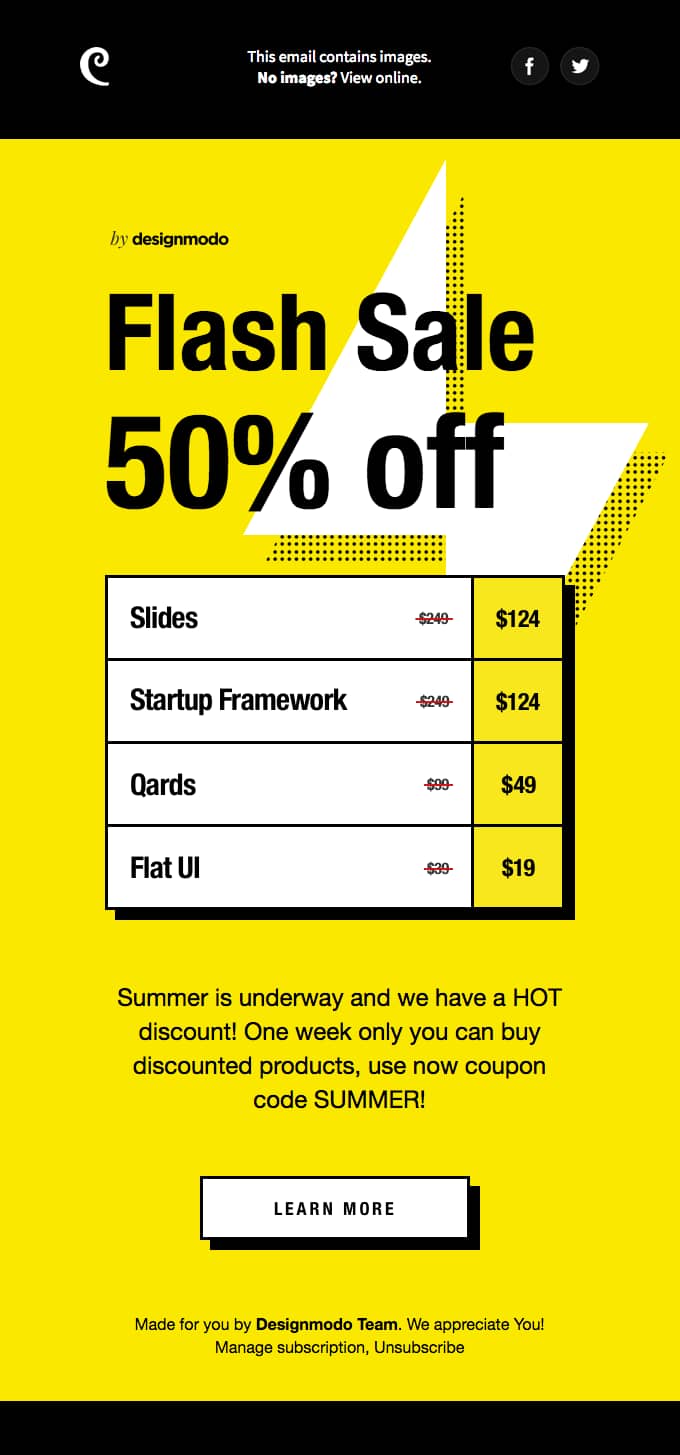
The email content is bold and to the point. As soon as you open, you know how much discount you’ll get (a substantial 50%), with some tangible examples. There’s also a clear deadline and CTA to inspire action.
2. Bundle elastic products with higher-value items
Bundle elastic products with inelastic ones to make them more appealing without dropping prices.
Buyers are more likely to commit if they feel they’re getting extra value and not just paying less because of a discount. This approach works exceptionally well when you’re selling on a smaller scale and margins are already tight, as you can protect your profit while finding ways to grow.
Here are some effective pairings:
-
Must-have product + helpful add-on (e.g., business laptop bundled with an annual cloud storage plan)
-
Core service + complementary support (e.g., monthly social media management with content marketing strategy sessions included)
-
Entry-level tool + a premium feature (e.g., a basic CRM plan in a package with three months of advanced reporting)
HP is a hugely successful brand that uses bundling in its business store, pairing elastic and inelastic products to grow sales. Look at all the bundle options available on this single product:
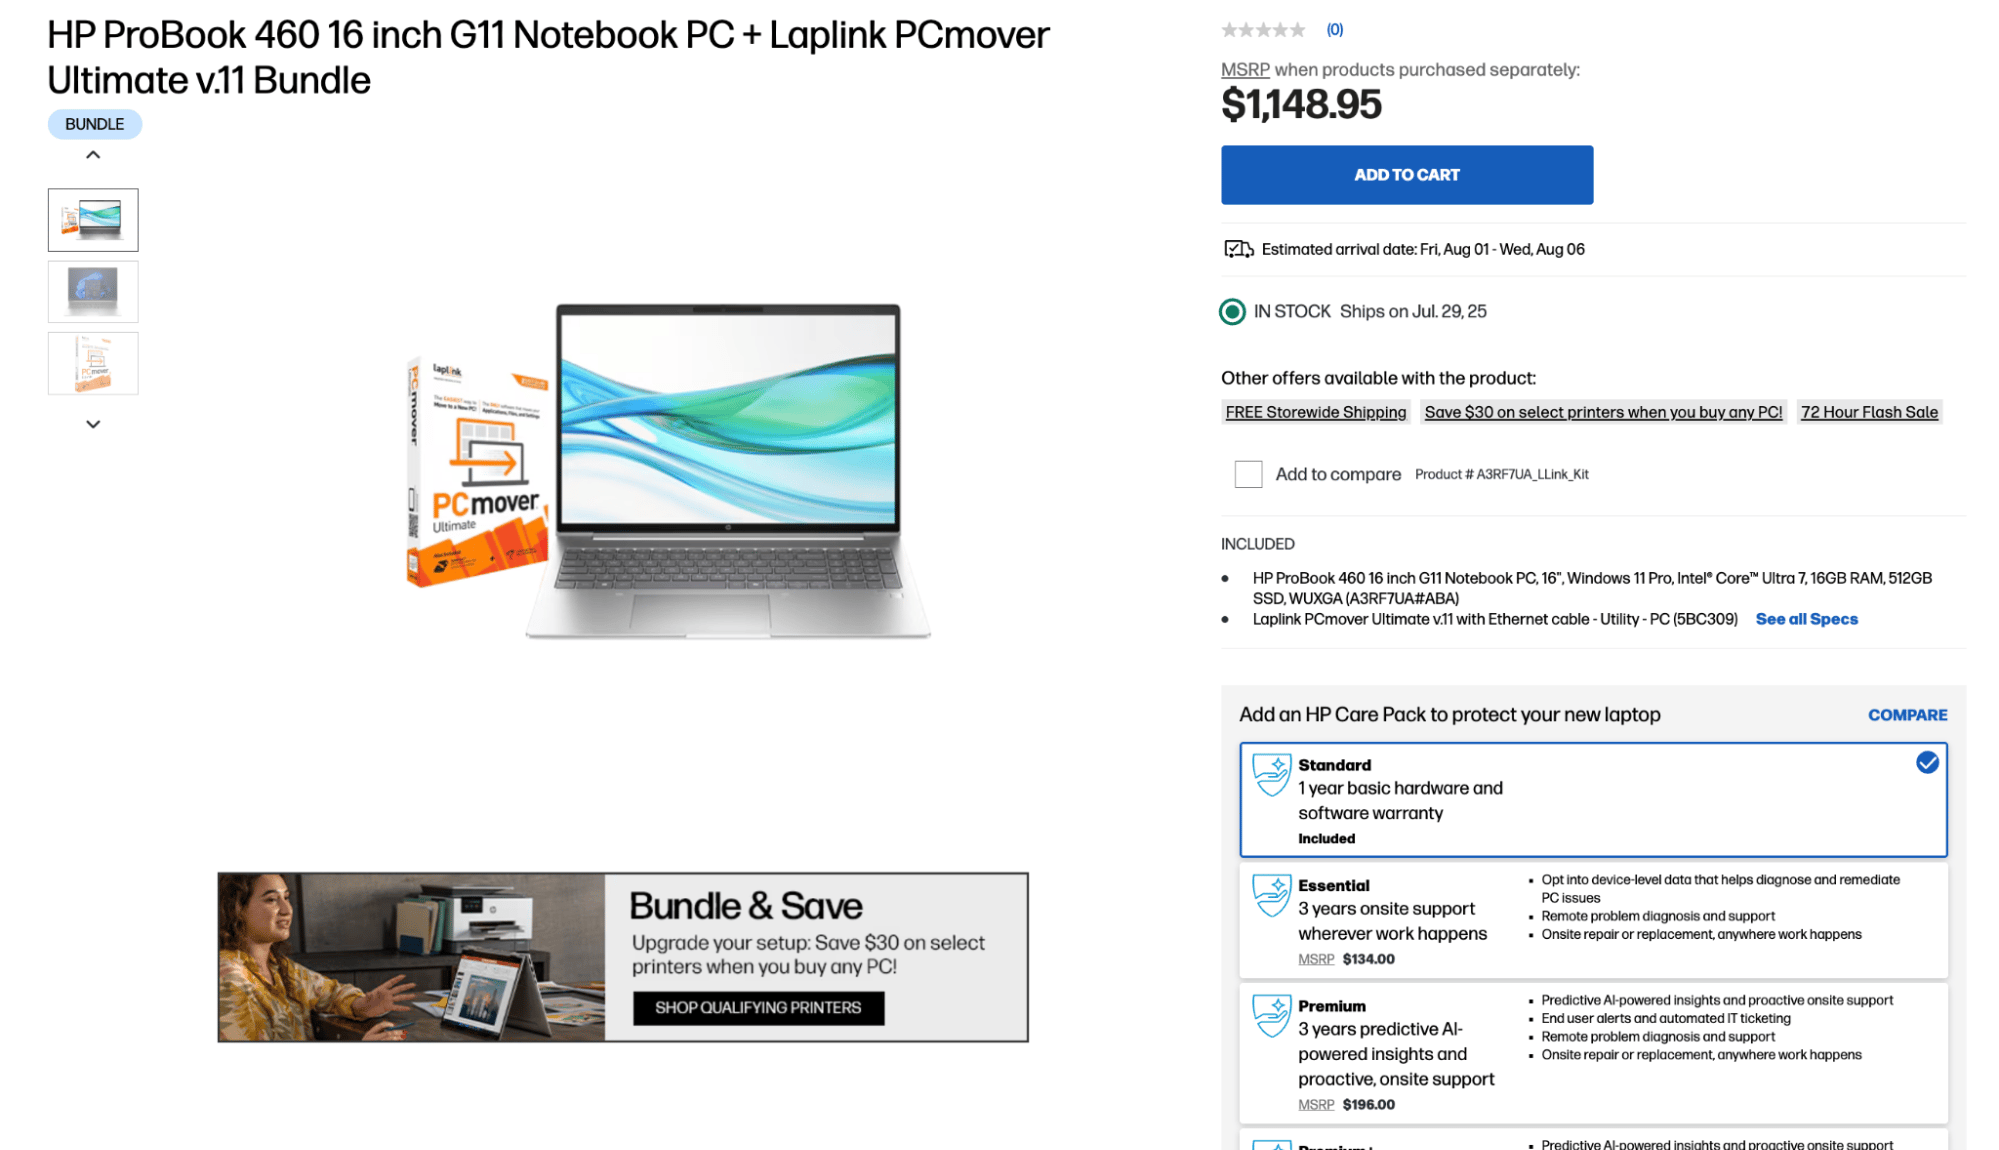
High-spec laptops are essential to HP’s professional audience, but the products it bundles with them – file transferring software, printers and extended warranties – are not. These extras have more elastic demand on their own but feel more valuable as part of a package.
Bundling is an entirely scalable pricing technique. Although HP is a major brand, it works just as well for lower-cost items and smaller target audiences.
Want to Learn How to Influence Your Prospect’s Buying Decisions?
Get inside the head of your customers and take advantage of consumer psychology with this Psychological Selling Guide.
3. Plan pricing tiers based on how audiences respond to price
Create pricing plans that reflect how much different customer types are ready to pay.
Elastic segments convert more often at lower prices. To attract them, offer a cheaper entry-level plan, then upsell later once they’ve seen your product’s value.
Inelastic segments will likely pay for premium features like supported onboarding and out-of-hours help. You’ll still need to prove value, though. Tailored product demos and case studies will help close those deals.
For example, small SaaS company Balloon has three pricing options:
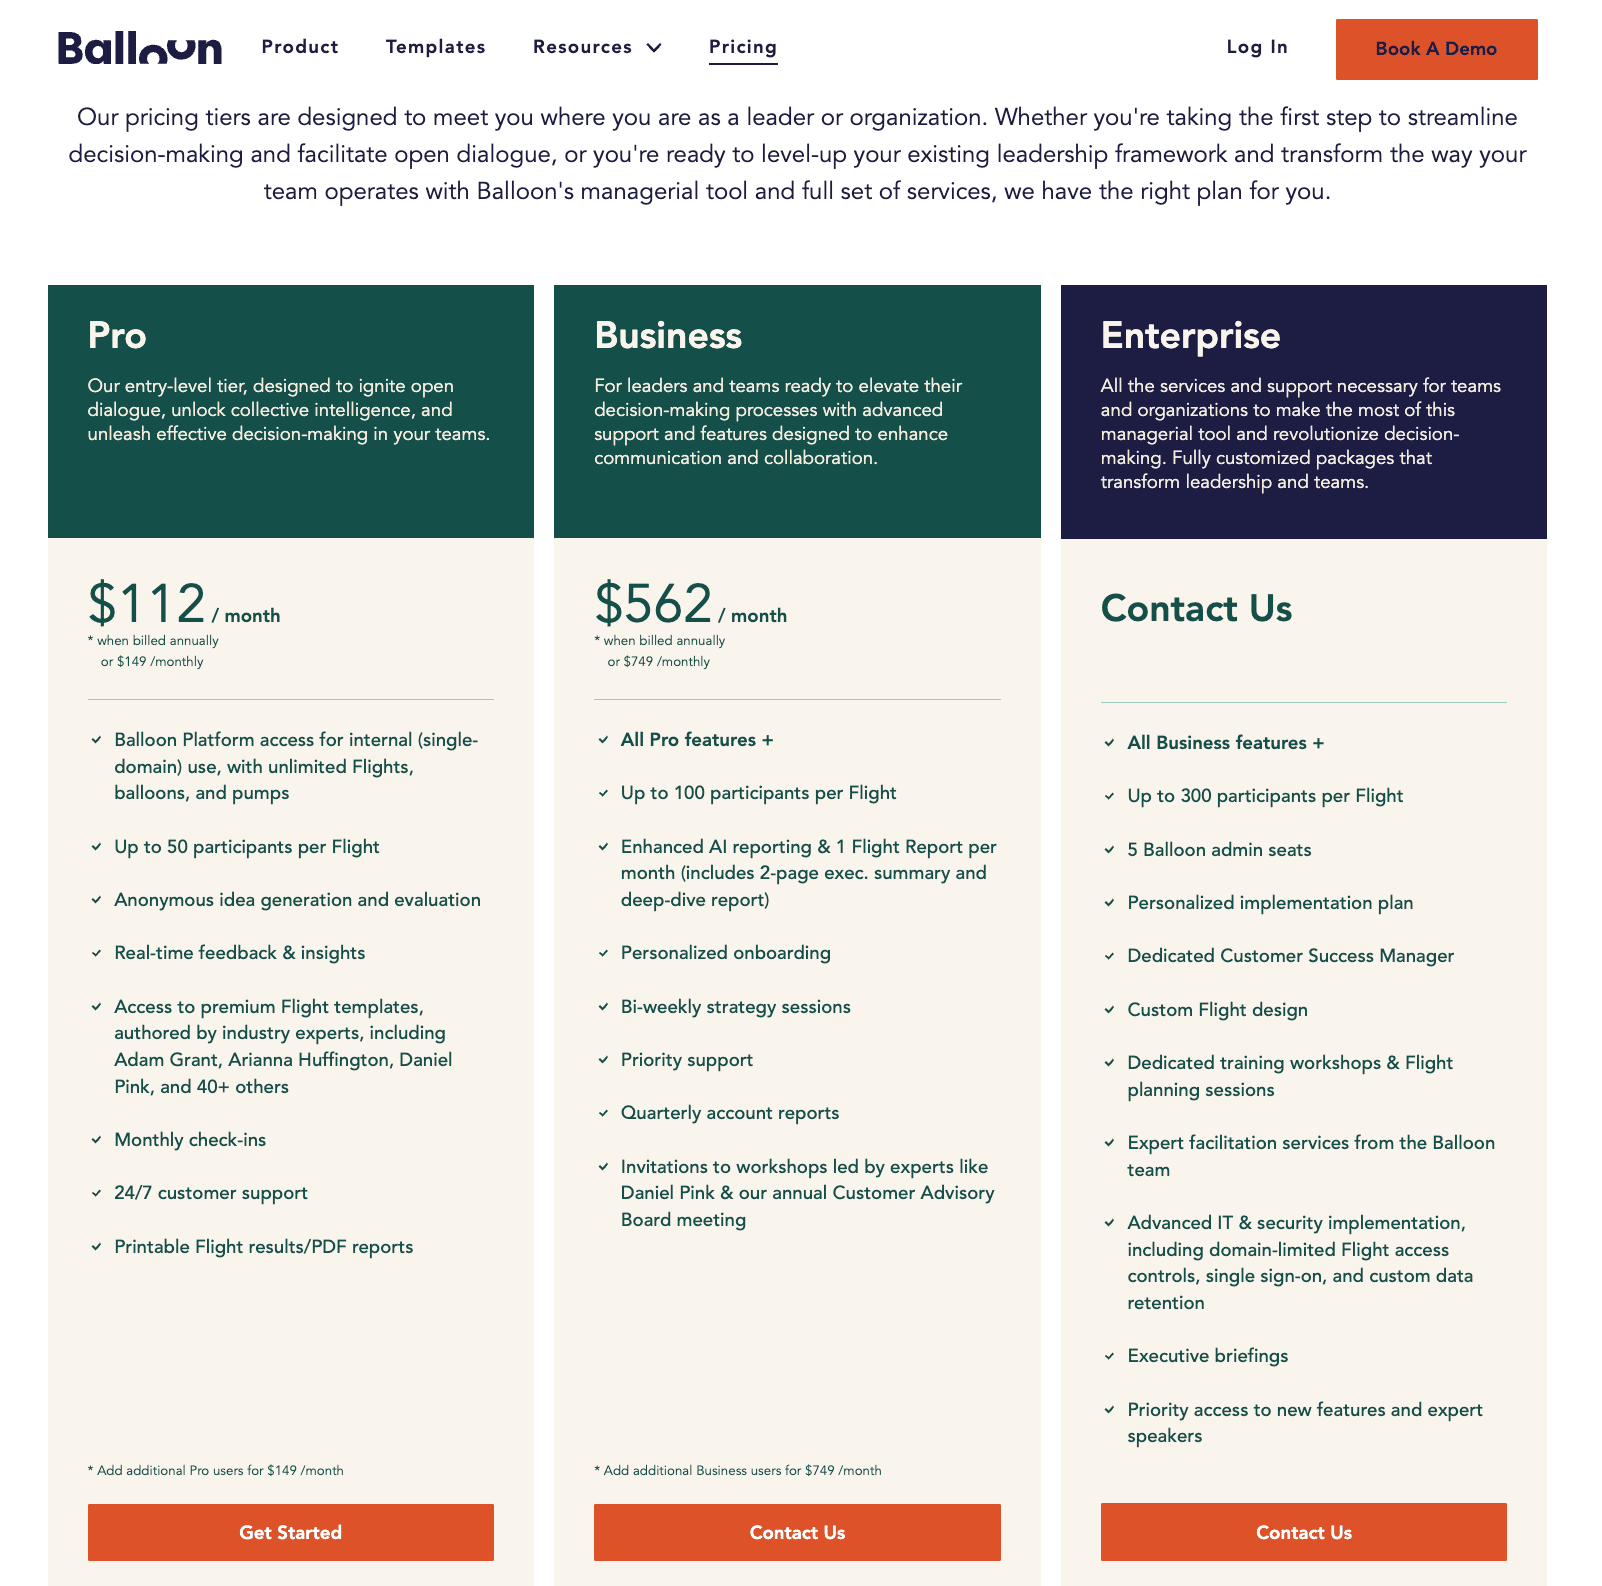
The Pro tier has fewer features but is less than a third the cost of the next option. You can also “Get Started” instantly. The Business and Enterprise tiers are more expensive and use a “Contact Us” CTA instead, letting the sales team prove value before asking for a bigger commitment.
Note: Tiered pricing harnesses the framing effect, where people naturally compare options side by side. A mid-range option often just feels right when it’s between cheaper and more expensive choices. It becomes the “safe” choice.
4. Use a freemium model to win over elastic buyers
If it suits your product, use a freemium model to remove the entry barrier entirely. Freemium is where you offer a limited free plan to demonstrate value and then upsell users by inviting them to upgrade as their needs grow.
Many low-cost business tools in competitive markets use this approach. Giving free access in the short run helps them hook prospects and build trust, creating momentum.
For example, Dropbox offers 2GB of free cloud storage. It makes money by upselling those free users to one of four paid packages:

Many price-sensitive Dropbox customers start by storing files in a free account. The more they add, the more valuable the service becomes to them and the more likely they are to upgrade.
They could choose the $9.99/month Plus plan when that time comes. However, the “Best Value” Professional tier, with extra storage and security, might be just as appealing for $16.58/month.
Technically, those free users could switch providers, but that means moving files across (extra effort) and rebuilding trust with another company. The freemium model stops it from happening.
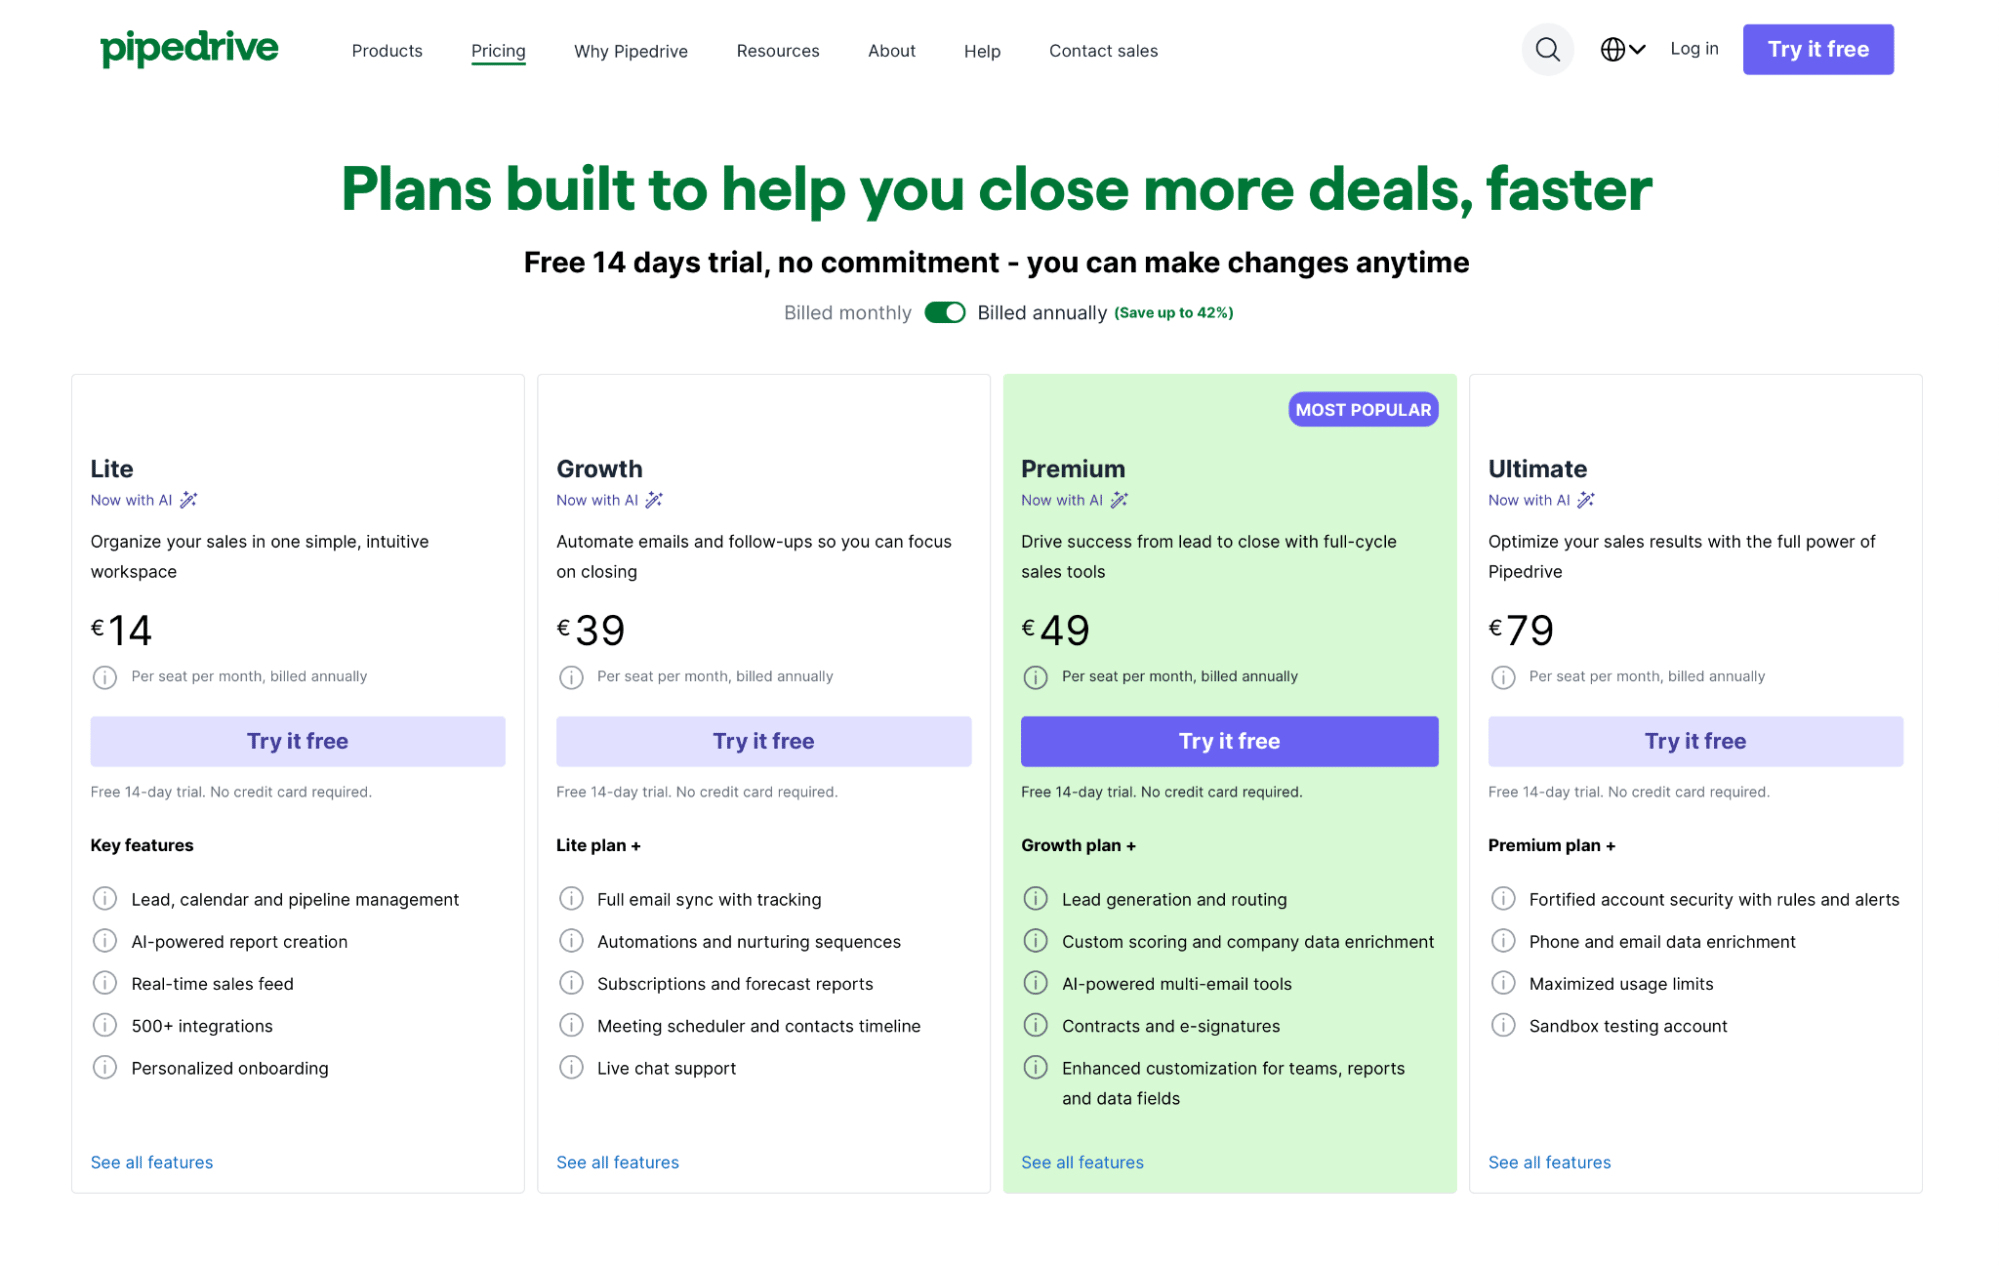
Not every product suits a true freemium model. If offering a permanently free tier isn’t viable for your business, a time-limited free trial can achieve a similar goal: reducing the barrier to entry and letting elastic buyers experience your product’s value before they commit.
For example, Pipedrive offers a 14-day free trial with full access to premium CRM features. This free trial makes it easy for teams to explore and test the platform risk-free and upgrade with confidence when they’re ready.
Recommended reading
Psychological selling guide: How to better understand your leads
Use your CRM to track pricing impact
Once you’ve tried a pricing tactic, the next step is to measure its real-world impact. The goal is to learn what works (or doesn’t) and make better strategic decisions.
This context is where your CRM system becomes more than a contact database. It’s your control panel for tracking how pricing changes affect deal size, conversion rates and sales cycles.
Use your CRM dashboards and reporting features to monitor the following sales metrics:
-
Lead-to-deal conversion rates. See whether pricing changes are convincing more prospects to say yes. A drop points to resistance. An increase shows you’ve found a better fit.
-
Deal value by segment. Compare deal sizes across different types of customers. You’ll quickly learn which segments are most sensitive to price and who’s happy to pay more.
-
Sales velocity and average time to close. Look at how long deals are taking to move through the sales pipeline. Faster closes prove that your new pricing is more compelling or clearer.
Pipedrive’s Insights dashboard makes analysis effortless. Build custom reports by product, sales funnel stage or customer type and see the impacts of pricing changes over time.
This feature is handy for spotting trends after promotions or discounts:

Ultimately, sales metrics provide real-world feedback on how price elasticity impacts your business, so you can confidently keep improving.
Recommended reading

How to measure and track your entire sales team’s performance
Price elasticity of demand FAQs
Final thoughts
Price elasticity is a core concept in microeconomics, but it’s just as valuable to small business leaders, sales pros and marketers.
More than just theory, it’s a powerful tool for better decision-making – one that helps you plan effective promotions and product launches, even when margins are tight.
So, instead of guessing how audiences will react to price decreases or how a price increase will impact your demand curve, start pulling historic sales records from your CRM and back your strategies with data.
Download Your Sales and Marketing Strategy Guide
Grow your business with our step-by-step guide (and template) for a combined sales and marketing strategy.