Our view at Stack - Pipedrive is a robust CRM platform, offering automation, contact data collection, webhooks, AI-powered sales assistant, email communications, email marketing, and customisable sales pipeline workflows.
In the SaaS industry, rapid changes make pinpointing the causes of success or setbacks difficult.
SaaS reporting tracks vital metrics to determine what’s working and what isn’t, turning data into actionable insights. In this article, you’ll learn about SaaS reporting and which SaaS metrics drive business success.
What is SaaS reporting?
SaaS reporting analyzes and presents data from your software-as-a-service (SaaS) company to gauge performance, optimize the user experience and refine business strategies.
It involves tracking key performance indicators (KPIs) like user engagement, customer acquisition costs and churn rate.
Recommended reading

94 business abbreviations and what they mean
How SaaS reporting drives business success
SaaS reporting answers questions about your business’s performance. These answers drive success by helping you:
-
Improve decision-making. SaaS reporting analyzes data about customer behavior, sales trends and efficiency and distills it into a straightforward format to help you make data-driven decisions.
-
Track performance. SaaS reporting enables real-time performance tracking through KPIs and metrics. Monitor critical areas like revenue growth, conversion rates and customer lifetime value, ensuring you stay on track.
-
Boost operational efficiency. SaaS reporting streamlines processes and increases productivity by analyzing workflows to help you find bottlenecks and areas for improvement.
-
Find growth opportunities. SaaS reports provide strategic insights into market dynamics, helping you find growth opportunities. Companies that leverage data-driven insights have a strategic edge over those that rely on intuition.
-
Predict seasonal trends. SaaS reporting analyzes historical data to find future trends, meaning you can accurately forecast demand.
-
Experiment with new strategies. Access to detailed reports enables you to test and optimize new approaches in real time.
Recommended reading

4 steps to turn sales reporting data into actionable insights
3 tips for effective SaaS reporting
To get the most out of your SaaS reporting strategy, define your objectives, invest in powerful SaaS reporting tools and track the right metrics.
1. Define your objectives
The first step in effective SaaS reporting is defining clear objectives. Understanding your goals helps you focus data collection and analysis on the most relevant insights.
Some helpful questions to ask yourself include:
-
What business goals are you trying to achieve? Are you aiming to increase revenue, improve customer retention or enhance operational efficiency?
-
Are you tracking the entire business or a particular team? Which departments or teams have the highest impact on your sales objectives? Are there specific teams that could benefit from increased focus and insights?
-
What time frame are you focusing on? Are you more interested in short-term adjustments or long-term strategic planning? How far back do you need to go to spot meaningful trends? Do you have goals that rely on understanding historical data?
-
Are you addressing specific challenges or opportunities? What challenges (like declining sales) are you trying to tackle? Are there emerging opportunities (like new customer segments) that you want to explore?
These questions will serve as a roadmap for defining the scope and direction of your SaaS reporting. Once you know your goal, create a list of specific objectives. Here are three examples:
-
Improve customer retention rates. Analyze data to find factors contributing to churn and opportunities to improve customer loyalty
-
Enhance product features. Gather usage statistics to inform product development and prioritize feature improvements
-
Increase revenue growth. Track sales metrics and customer acquisition costs to find opportunities for upselling or cross-selling
2. Choose the right tools
With SaaS reporting tools, gathering data and making strategic decisions is easier. Collect, analyze and present data automatically in easy-to-understand visualizations.
Here’s a list of the different types of SaaS reporting tools:
|
Type of tool |
Example |
|
Business intelligence (BI) software: analyze large data sets and provide actionable insights for BI reporting |
Tableau, Power BI, Looker Studio |
|
Data visualization tools: convert complex data sources into easy-to-read formats like graphs and charts |
Pipedrive, Google Data Studio, Domo |
|
Customer analytics tools: analyze customer data, providing insight into behavior, preferences and engagement patterns |
Pipedrive, Mixpanel, Amplitude |
|
Financial analytics tools: provide detailed financial reporting, helping you track revenue, expenses and KPIs |
QuickBooks, Sage Intacct, Xero |
|
Marketing analytics tools: measure and optimize marketing performance across channels |
Pipedrive, Google Analytics, Marketo |
|
Product analytics platforms: track and analyze product use, helping you develop and optimize your offerings |
Pendo, Heap, FullStory |
Choosing the right mix of tools ensures your SaaS reporting is comprehensive and accurate while supporting your objectives.
3. Track the right metrics
The final step is analyzing the SaaS reporting metrics that best support your goals. Knowing what you want to figure out helps identify the right metrics to track.
Are you looking to improve customer satisfaction or drive SaaS sales growth? Each goal needs specific metrics to provide data-driven insights for informed decision-making.
Are you trying to:
-
Improve customer relationships? Consider measuring your customer satisfaction score and net promoter score
-
Increase revenue growth? Consider monthly recurring revenue and customer lifetime value
-
Enhance your products? Track feature adoption rates and user engagement metrics
-
Optimize marketing strategies? Focus on conversion rates and cost per acquisition
-
Improve sales performance? Track metrics like sales conversion rate and lead-to-opportunity ratio
Below, we’ll explain these metrics and how to use them to gain actionable insights.
Recommended reading

What is sales efficiency? Definition, metrics and strategies
10 key Saas metrics to track
Here’s how to track the most important metrics for SaaS.
1. Average revenue per user (ARPU)
ARPU measures the average monthly revenue your business generates from each user. Tracking ARPU lets you see whether you should introduce new pricing tiers, upselling strategies or product offerings.
A higher ARPU indicates customers value your offerings, which can translate to long-term profitability. Conversely, if your ARPU is lower than expected, you might want to introduce new pricing tiers and leverage underserved market segments.
To calculate ARPU, divide the total revenue you received in a given period by the number of active users.
Let’s say your SaaS company generated $200,000 in revenue in October and had 1,000 active users in the same period:
ARPU = $200,000 / 1,000 = $200
The ARPU is $200, which means each active user generated $200 in revenue for your company in October.
2. Churn rate
The churn rate measures the percentage of customers who stop using your service over a specific period. Tracking churn rate highlights ways to enhance customer retention strategies or improve service quality.
A high churn rate might mean you have competitive offers that draw customers away. A lower churn rate suggests your offerings keep customers satisfied.
If you notice a sudden increase in churn rate, you could conduct customer feedback sessions to identify pain points. In contrast, a consistently low churn rate indicates strong customer engagement and an opportunity to expand your offerings.
To calculate the churn rate, divide the number of customers lost during a period by the total number of customers at the start of that period, then multiply by 100 to get a percentage. If you start October with 1,000 customers but lose 50 by the end of the month, it means you have a 5% churn rate.
3. Cost per acquisition (CPA) or customer acquisition cost (CAC)
CPA measures the average cost of acquiring a customer through specific marketing efforts. Tracking CPA and CAC helps you assess campaigns and channel performance.
For instance, if your CPA is high, you might need to optimize ad spend or improve messaging. A lower CPA indicates efficient marketing spend and targeting, suggesting your strategies are worth scaling.
To calculate CPA, divide the total cost of a marketing campaign by the number of paying customers acquired from that campaign.
CAC is a similar metric that calculates the total cost of acquiring a customer across all marketing and sales efforts. To calculate CAC, divide the total acquisition costs over a specific period by the number of new customers.
4. Customer engagement score (CES)
CES combines interaction metrics like login frequency, duration and type of engagement. It’s a holistic measure of customers’ engagement with your service.
Tracking the customer engagement score lets you find highly engaged users and those at risk of churn. If CES is low, you might need a better user experience or more features. If it’s high, there are opportunities for upselling or turning satisfied users into brand advocates.
To calculate CES, combine data points into a weighted formula. Let’s say your SaaS platform considers two main factors for engagement: the number of logins per week and the time spent per session.
You weigh each activity. For instance, a user logs in five times a week (five points) and averages 30 minutes per session (one point per 30-minute session). You score and combine these elements to get a CES of 10 points.
5. Customer lifetime value (CLTV)
CLTV (also known as LTV or CLV) estimates the total you expect the customer to spend over the entire relationship. Tracking CLTV helps gauge return on investment for acquisition costs.
If your CLTV is rising, it means your retention strategies are practical and customers get a lot of value from your services. If it’s lower than expected, you might need to enhance customer service or refine pricing structures.
To calculate CLTV, multiply the average purchase value by the purchase frequency, then multiply the result by the average customer lifespan.
Say you have an average purchase value of $100, an average purchase frequency of 5 times a year and an average customer lifespan of 3 years:
CLTV = 100 x 5 x 3 = $1,500
This CLTV shows each customer will generate $1,500 in revenue throughout their relationship with your company.
6. Customer satisfaction score (CSAT) and net promoter score (NPS)
CSAT measures customer satisfaction with your software. It’s a survey asking customers to rate their satisfaction on a scale (often 1 to 5), giving immediate feedback on customer experience.
NPS is a similar metric that asks customers how likely they are to recommend your product on a scale of 0 to 10. Based on their responses, customers are promoters (9-10), passive (7-8) or detractors (0-6).
Tracking CSAT and NPS helps you identify strengths and areas needing improvement. High scores show customers like your offerings, while low scores point to potential issues that need addressing.
7. Feature adoption rate
Feature adoption rate tracks how frequently your users engage with specific product features. It helps you understand which features are popular or underutilized, providing insights into user preferences.
Tracking feature adoption rates lets you prioritize development efforts and refine product management roadmaps. When a feature has a high adoption rate, users find it valuable, suggesting you should build on it. A low adoption rate shows a need for better onboarding or accessibility.
To calculate the feature adoption rate, divide the number of users who adopted a feature by the total number of active users, then multiply by 100 to get a percentage.
8. Lead source
Lead source tracks whether leads come from social media, referrals, search engines or other channels. Tracking lead sources helps you work out which channels attract quality leads.
When a lead source consistently drives high-value customers, it warrants increased investment. However, if a lead source underperforms, it signals the need to adjust marketing strategies or reallocate the budget.
Businesses use tools to track and segment leads based on their origin. For example, a company might find that 50% of its leads come from organic search, 30% from paid ads and 20% from social media.
Based on this information, it can increase content marketing and advertising efforts to leverage its two primary lead sources.
9. Lead-to-opportunity ratio
The lead-to-opportunity ratio measures how effective your sales process is at converting leads into qualified sales opportunities. It provides insight into the quality of your leads and your sales team’s efforts.
Monitoring this metric helps you track the performance of your marketing and sales strategies. A higher ratio suggests high-quality leads are moving swiftly through your sales funnel. Low ratios show you must improve your sales processes.
To calculate the lead-to-opportunity ratio, divide the number of leads converted into opportunities by the total number of leads generated. Multiply the result by 100 to express it as a percentage.
10. Monthly recurring revenue (MRR) and annual recurring revenue (ARR)
Recurring revenue is the sales revenue generated by your subscribers. Tracking MRR and ARR is essential for SaaS businesses to understand revenue health and future growth.
A consistent increase in MRR or ARR suggests effective subscription models and customer retention strategies, while a decline suggests customer satisfaction or competition issues.
To calculate MRR, add the recurring revenue of your active subscriptions in a month. If you have 200 active subscriptions with a monthly fee of $50, your MRR would be $10,000. To convert this into annual recurring revenue, multiply it by 12 to get an ARR of $120,000.
Download our sales pipeline course e-book
In the Sales Pipeline Course, Timo Rein, co-founder of Pipedrive, teaches you how to make more sales with exclusive advice and insights in 11 valuable lessons.
How to use Pipedrive for SaaS reporting
Pipedrive is a powerful customer relationship management (CRM) tool that SaaS companies can use to gain insight into sales performance and customer interactions. Here’s how to use Pipedrive to excel at SaaS reporting:
View metrics with customizable dashboards
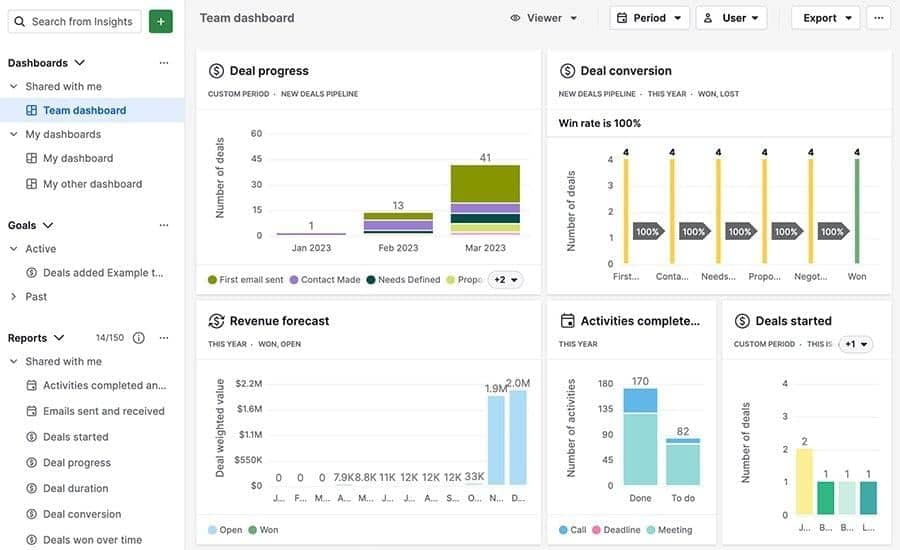
Create interactive dashboards to visualize metrics for your SaaS business. Dashboards include visual reports on sales performance, revenue forecasts and customer engagement, giving you a high-level overview of your business’s health.
Track deal progress with sales pipeline management

Use Pipedrive’s pipeline view to track deal progress through various stages, from lead generation to closing. Customize pipeline stages to match your sales process, identifying bottlenecks and predicting future outcomes.
Generate real-time reports
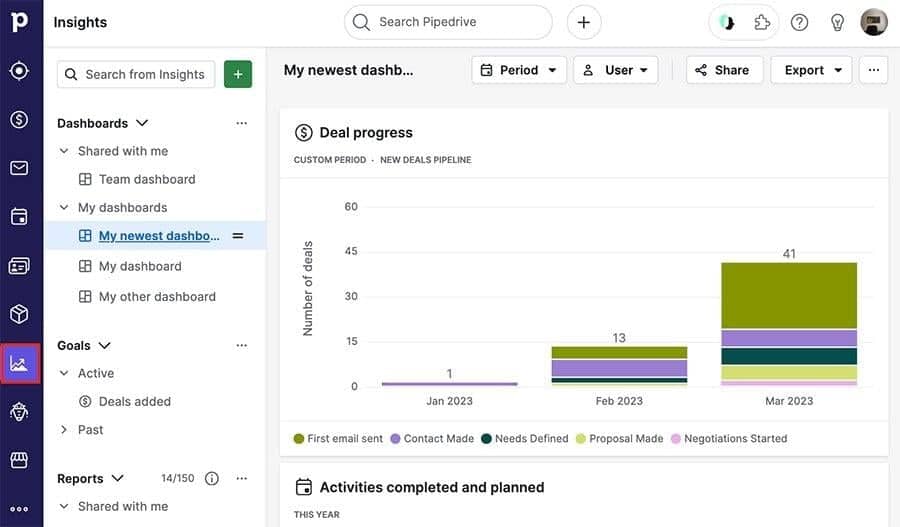
Generate custom reports to analyze sales performance, deal velocity and conversion rates. They provide historical and real-time insights, enabling data-driven decision-making and strategic planning.
Speed up reporting with workflow automation
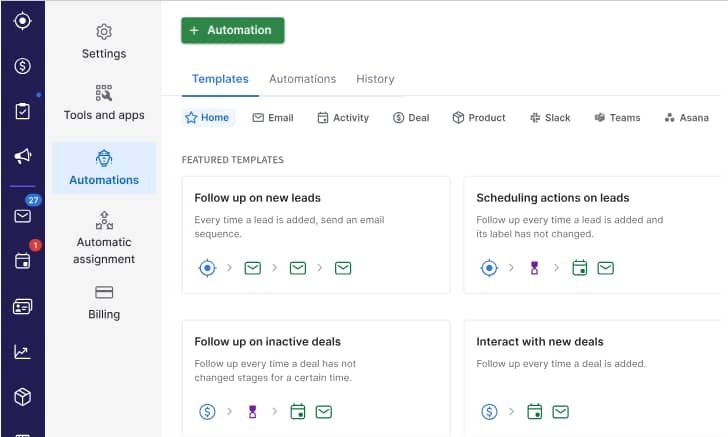
Use automation to reduce manual tasks like lead scoring, deal updates and notification triggers. It allows your team to increase productivity by focusing on high-value activities.
Track activities to understand customer behavior
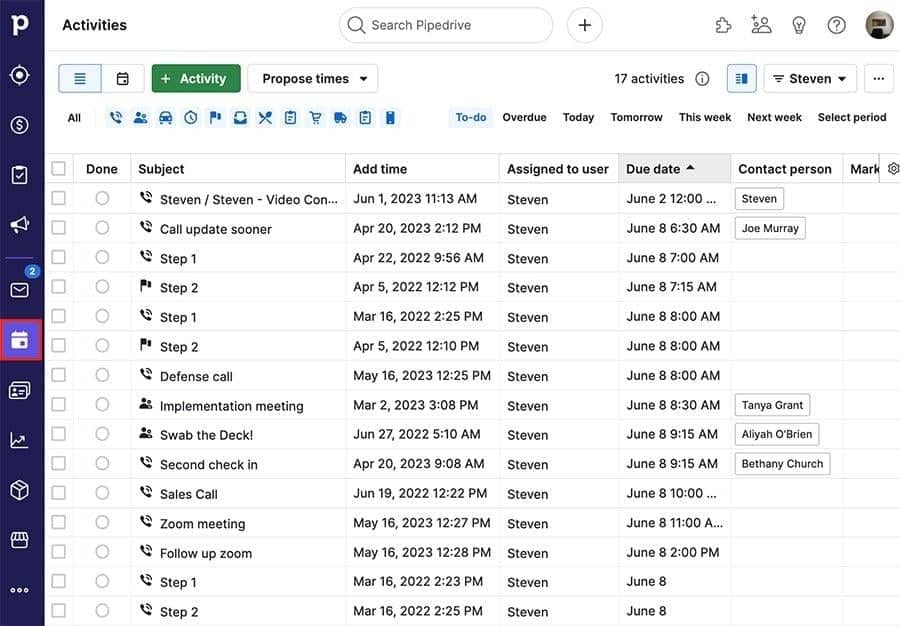
Track and log all activities and customer interactions, including calls, emails and meetings, directly within Pipedrive. Maintain detailed customer profiles to understand their behavior and improve sales strategies.
Attribute leads and track lead sources
Use Pipedrive’s lead-tracking functionality to analyze which sources bring in high-quality leads. Identifying top-performing lead sources helps optimize marketing efforts and allocate resources more effectively.
Forecast sales for better planning
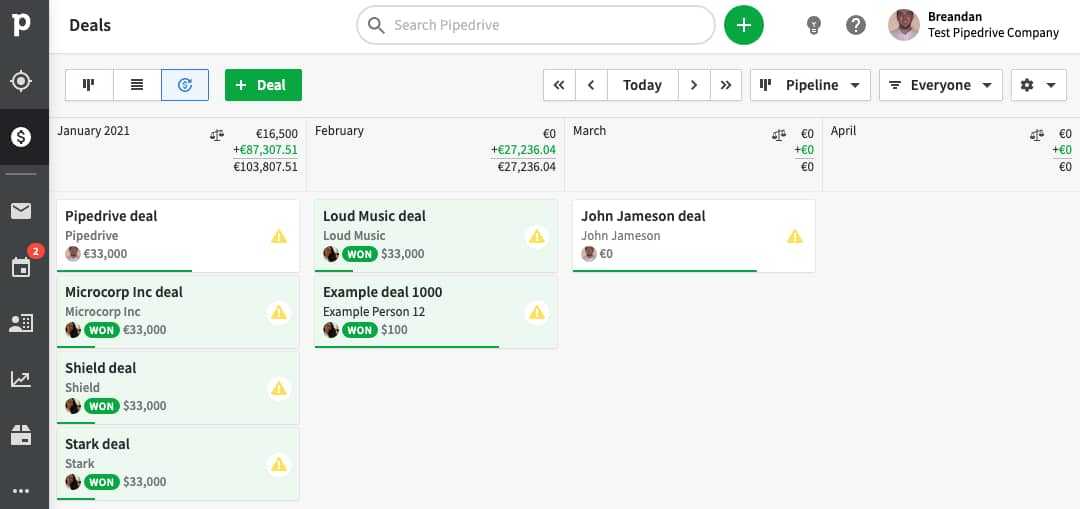
Pipedrive’s built-in forecasting tools predict future sales based on historical data and current pipeline status. Accurate forecasting improves financial planning and helps prepare for future growth opportunities.
Analyze CRM data with third-party tools

Integrate Pipedrive with other tools like SaaS analytics platforms and customer support systems. Connecting Pipedrive with different tools in its Marketplace allows you to create a unified ecosystem while gaining a complete view of customer interactions and business performance.
Recommended reading

Top 10 Pipedrive integrations to boost productivity
Final thoughts
Tracking the right metrics in the fast-paced SaaS landscape is vital for profitability and growth. It’s easy to lose yourself in day-to-day tasks, but SaaS reporting provides the clarity needed for strategic success.
Ready to enhance your reporting? Start your free trial with Pipedrive today and transform how you track crucial SaaS metrics.
If Pipedrive is of interest and you'd like more information, please do make contact or take a look in more detail here.
Credit: Original article published here.
