Our view at Stack - Pipedrive is a robust CRM platform, offering automation, contact data collection, webhooks, AI-powered sales assistant, email communications, email marketing, and customisable sales pipeline workflows.
Effective inventory management saves your business money, improves cash flow and reduces waste. By monitoring the right inventory sales metrics, you can avoid stockouts, reduce storage costs and order the right amount of stock.
In this article, you’ll learn what inventory sales metrics are and how they can help you make better stock decisions. You’ll also discover how to manage your inventory within Pipedrive’s CRM.
What are inventory sales ratios and why are they important?
Inventory sales ratios show how effectively you manage your inventory to meet customer demand. They help you spot sales trends, accurately forecast demand and determine whether you stock the right amounts.
In the following sections, you’ll learn about the three main inventory sales metrics, how to calculate them and how they can guide you in stocking more efficiently.
These metrics give you a clearer view of your inventory operations planning, helping you boost sales, improve customer satisfaction and respond better to market changes.
Recommended reading

What is production management? The definitive guide for business owners and prospective managers
1. Inventory turnover ratio
The inventory turnover ratio measures how often you sell and replace your average stock value over a given period. It compares your sales (using the cost of goods sold) with the average amount you’ve spent on inventory.
This ratio helps you check if your stock levels match the speed at which you sell stock (sales velocity). It shows whether you carry enough products to meet customer demand without overstocking or understocking.
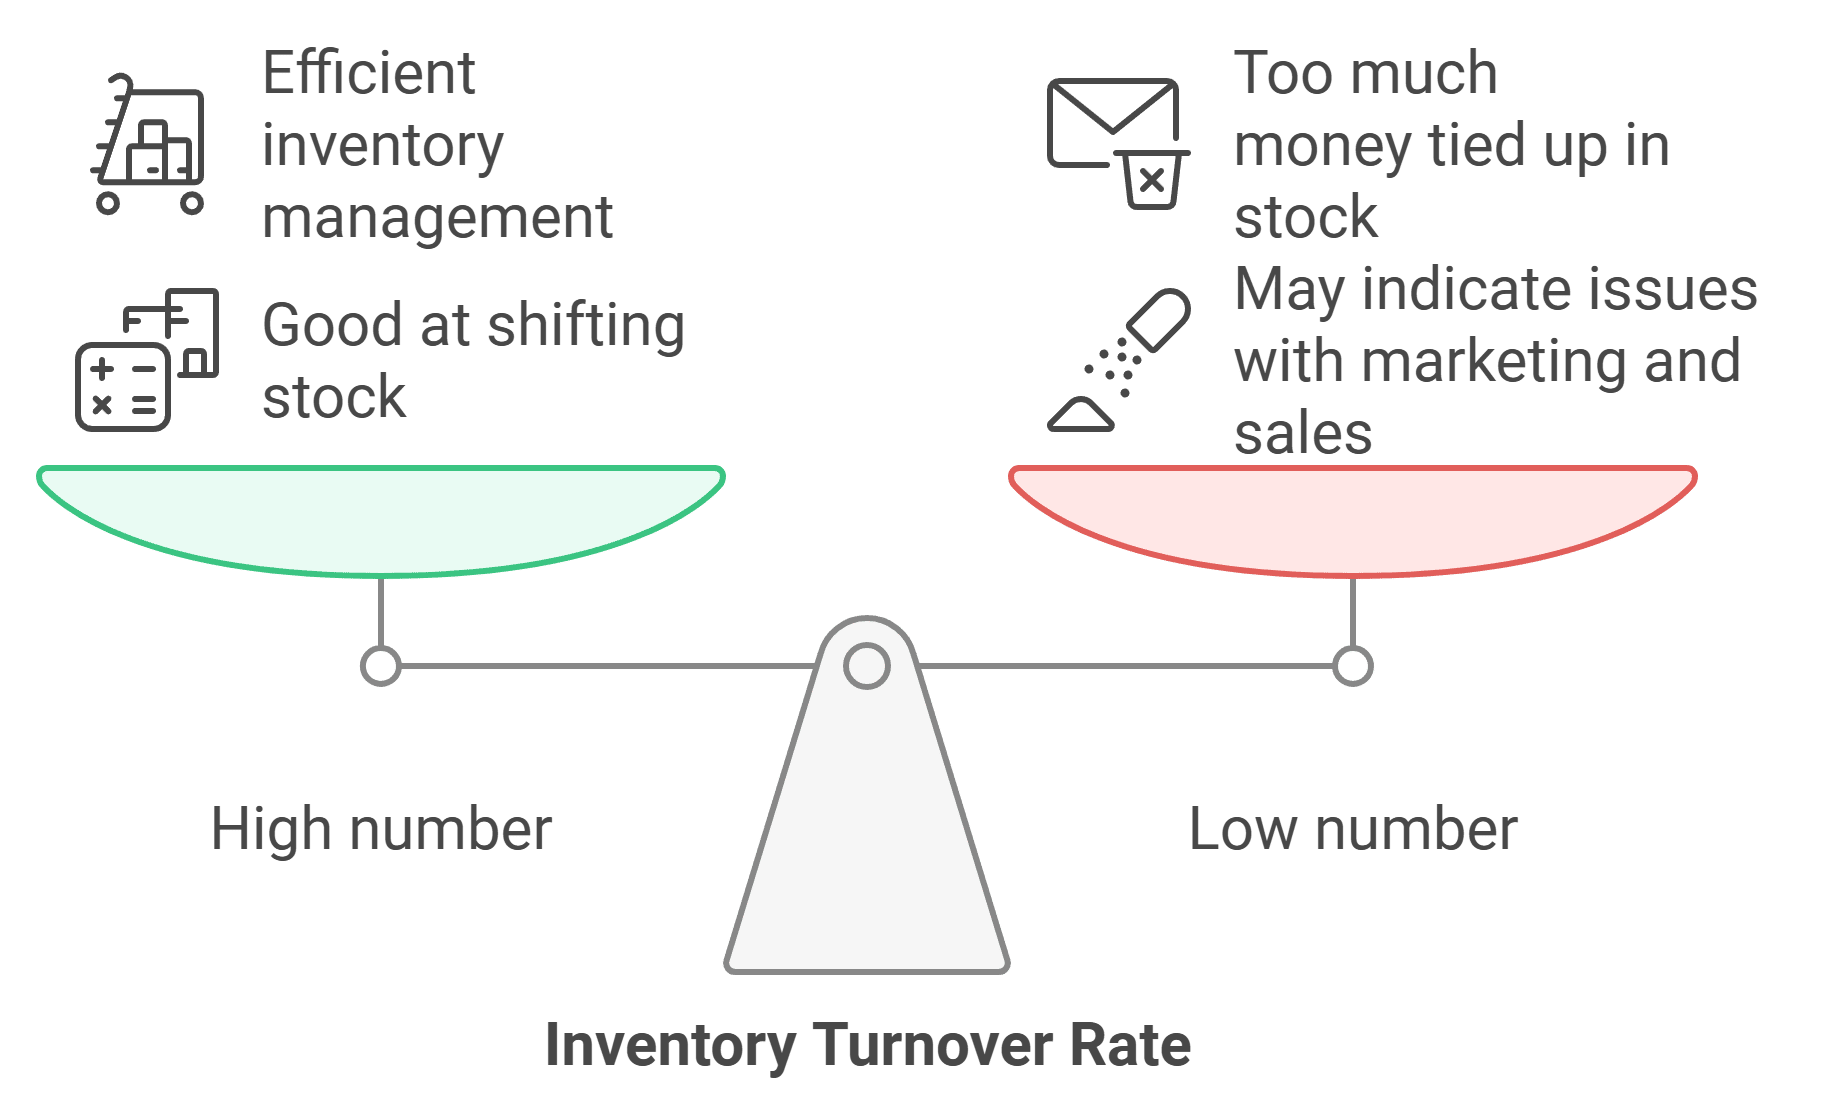
A high turnover ratio means you’re selling products quickly and maintaining healthy stock levels. A low ratio indicates slower sales, meaning your cash might be tied up in unsold stock. It could also suggest your teams are failing to hit their sales quotas. The longer your inventory remains unsold, the higher its risk of spoilage or becoming outdated.
Here’s how to work out your inventory turnover ratio:
Inventory turnover ratio = cost of goods sold / average inventory value
Cost of goods sold (COGS) is how much it costs to produce or sell the products you sell in a given period, including expenses like materials, labor and utilities. To find your average inventory value, add the inventory value at the beginning and end of the same period, then divide by two.
Let’s work through an example.
Imagine a B2B construction wholesaler supplying contractors and builders with building materials, safety gear and related items. Its COGS for the year is $200,000, and its average inventory value is $50,000.
The company’s inventory turnover ratio would be $200,000 divided by $50,000 = 4, which means it sold goods costing four times its average inventory value over the year.
Monitor this ratio to judge how much stock to buy from distributors and when. If your inventory turnover ratio drops, consider running a sale to clear excess stock, reducing the size of future orders or both. If the ratio increases, you may need to reorder sooner, order more or both.
2. Days sales in inventory ratio
The days sales in inventory (DSI) ratio shows how many days your current stock can last based on your average daily sales if you bought no new inventory. While the inventory turnover ratio tells you how often you sell and replace your inventory, DSI focuses on how long your current inventory will last based on your current sales rate.
You may also refer to DSI as inventory days sales, days sales inventory or daily sales inventory formula.
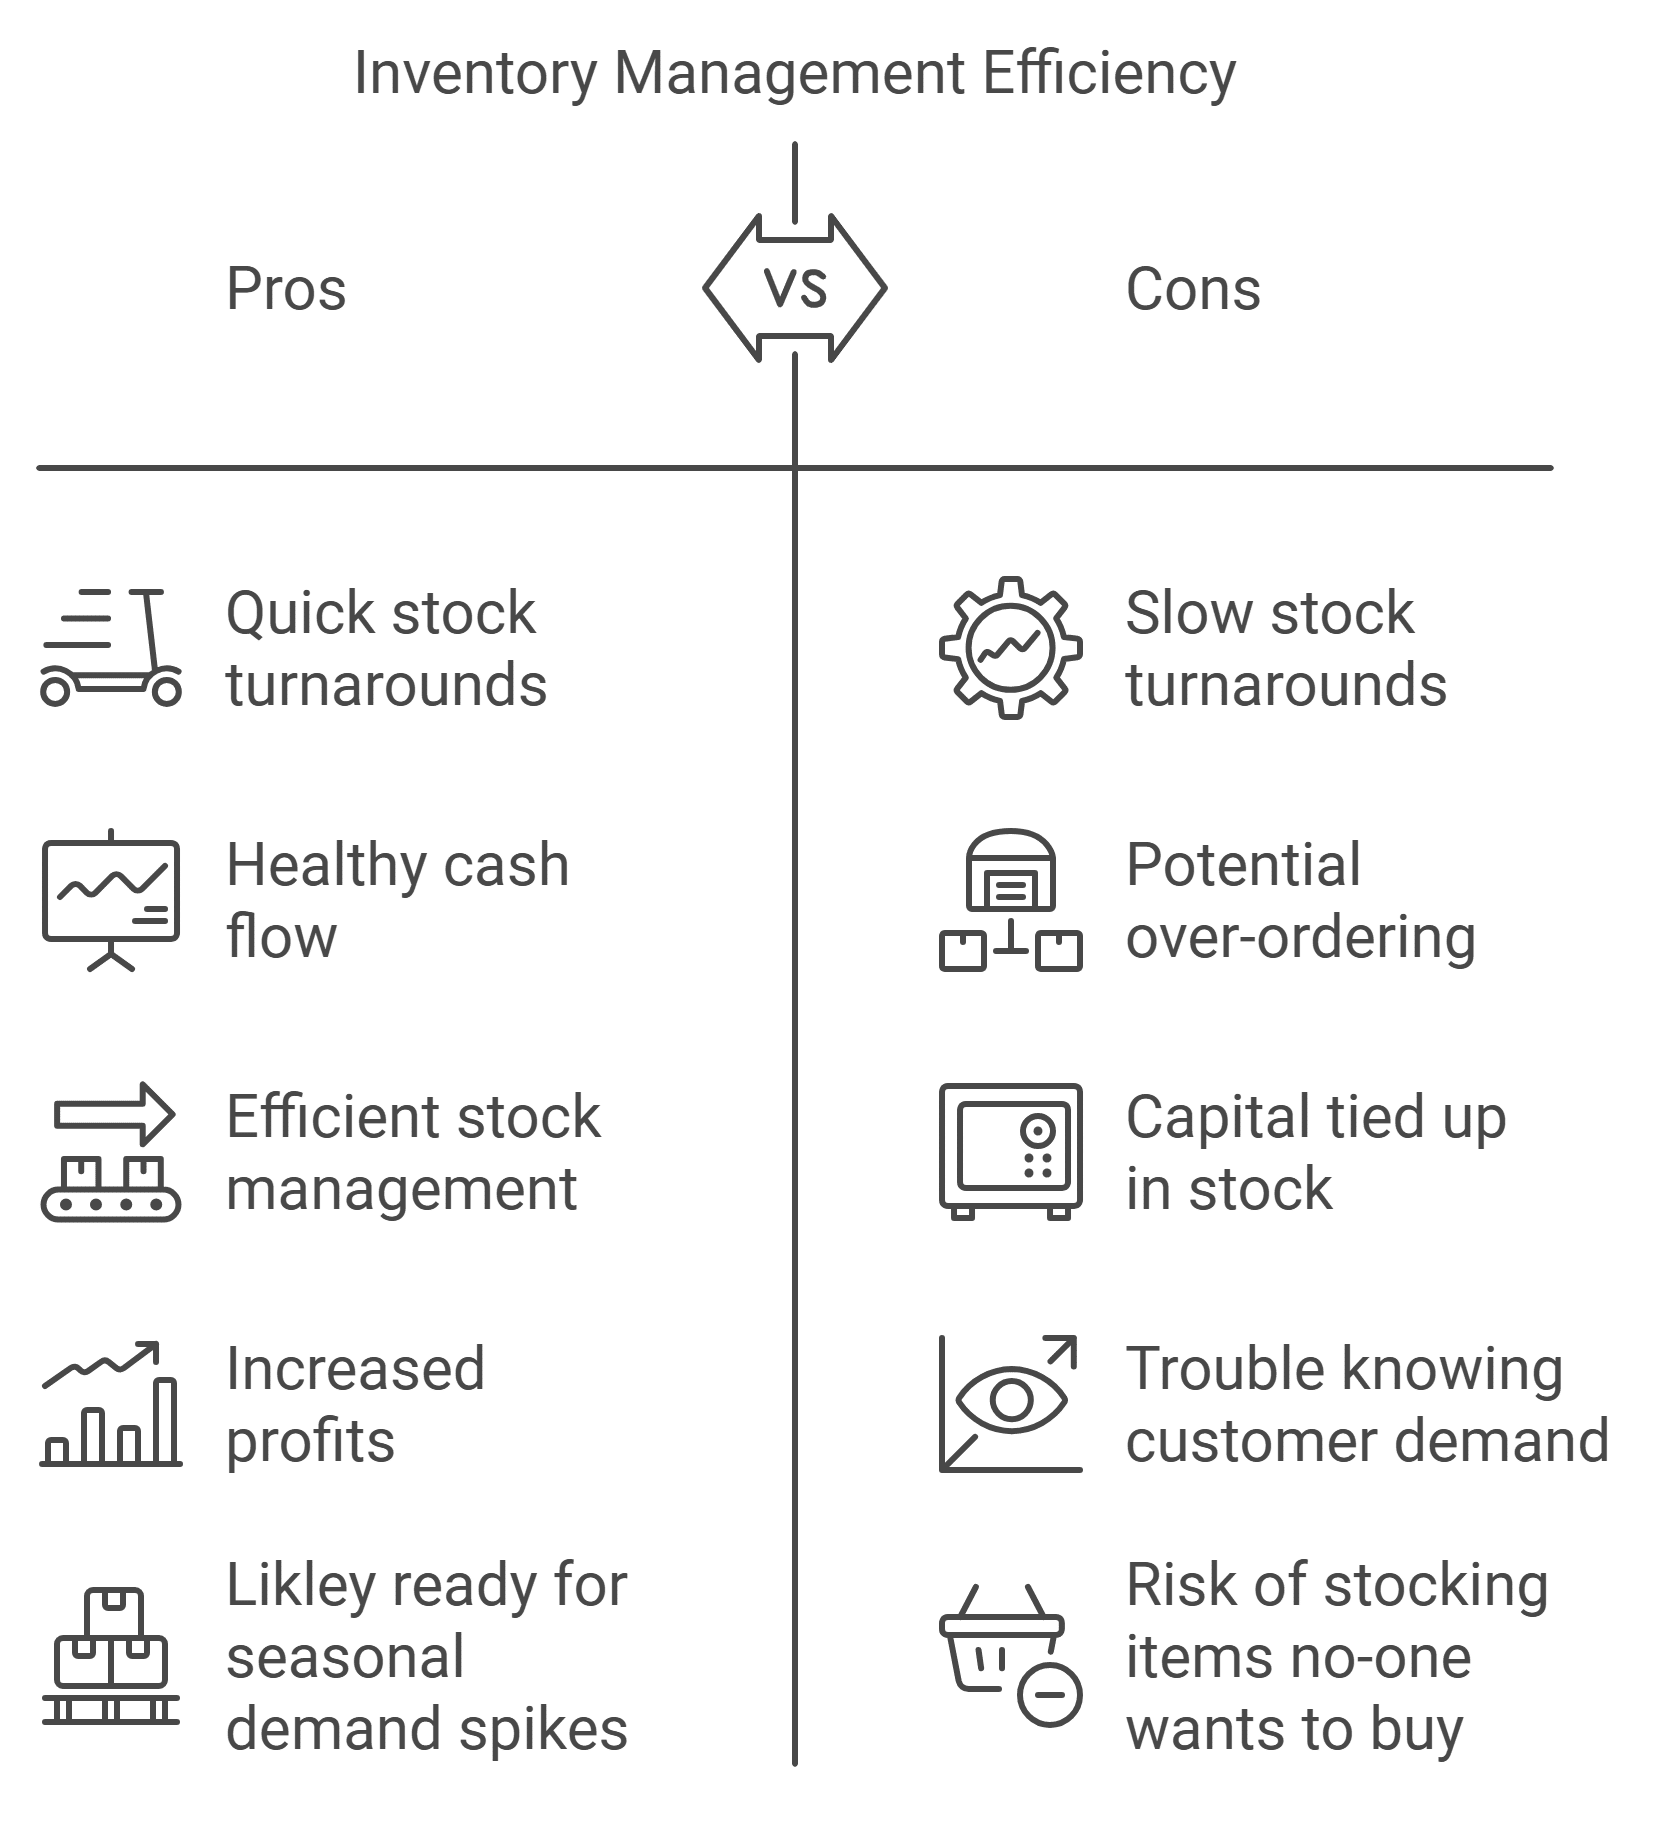
A low DSI means you’re selling inventory quickly and managing stock efficiently, which helps improve cash flow and increase profits by minimizing the costs of holding stock. It also means your business can respond better to seasonal demand spikes, as you have the cash and storage space to restock quickly.
A high DSI might suggest sluggish sales or excess stock tying up your cash. It could also indicate that you’re struggling to predict customer demand, leaving you with items that are hard to sell and take longer to convert into cash for restocking.
Here’s how to calculate your DSI ratio:
DSI = (average inventory value / cost of goods sold) × 365
Suppose the B2B construction wholesaler’s average inventory is $50,000 and COGS is $200,000. The DSI would be ($50,000 divided by $200,000) multiplied by 365 = 91 days, meaning it takes approximately 91 days to sell through its average inventory.
Monitor your DSI alongside your cash flow and seasonal trends to ensure you’re financially healthy and have enough stock to meet demand. A high DSI is fine when stocking up for a busy season. If it stays high, calculate the DSI for each product category to identify slower-moving products and fine-tune future purchasing decisions.
Note: Inventory turnover and DSI ratios differ significantly from sector to sector. According to recent Ready Ratios figures, DSI in manufacturing is 163 days, possibly because of longer production times and bulk orders. Compare this to a ratio of 10 for food and drink establishments – likely due to high demand and perishable products.
3. Inventory-to-sales ratio
The inventory-to-sales ratio (I/S ratio) shows how much stock you hold compared to your total sales over a set period. It’s a simple way to check if the money you spend on stock matches how quickly you sell your products.
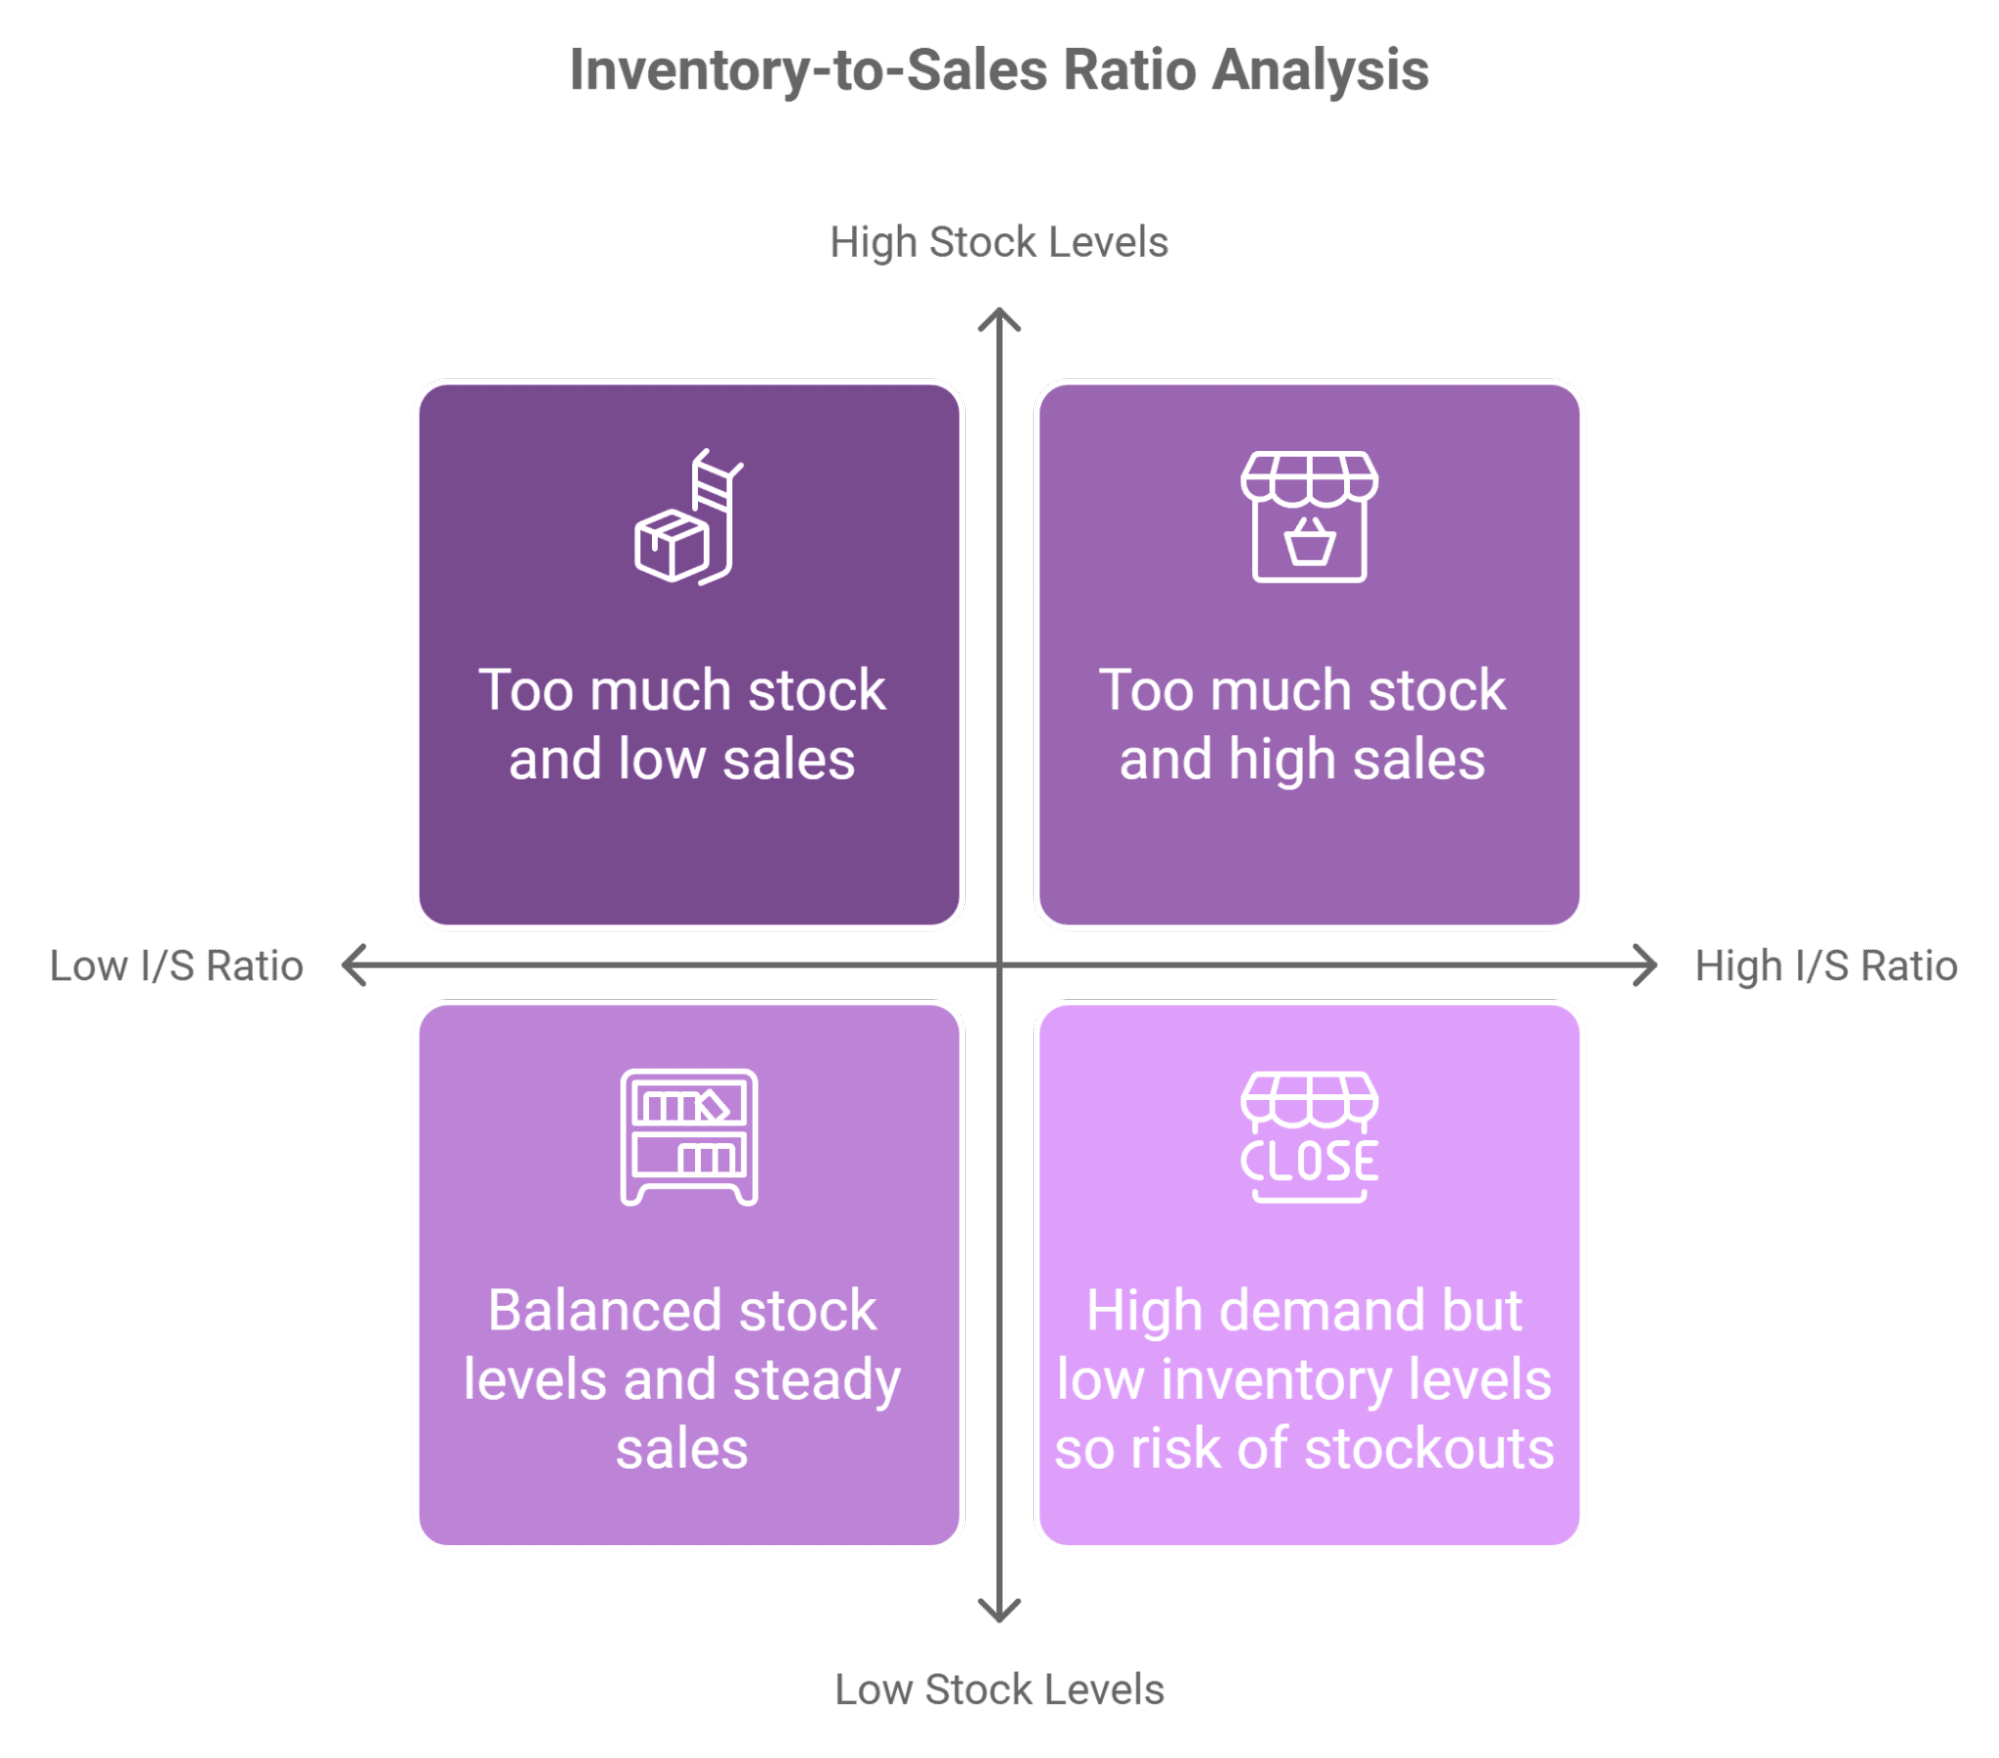
You need enough stock to meet demand but not so much that it stays on the shelves for too long. The I/S ratio helps you strike the right balance by showing how your stock levels compare to your sales performance.
High stock levels with low sales volumes indicate overstocking, which leads to higher holding costs and tied-up cash. On the other hand, low stock levels with high demand suggest you’re missing out on sales opportunities.
Here’s the formula to work out your I/S ratio:
I/S ratio = average inventory value / net sales
To find your average inventory value, add your starting inventory value to your ending inventory value over a given period, then divide by two. Net sales are your total sales revenue minus returns, allowances and discounts.
Imagine the B2B construction wholesaler’s average inventory value is $50,000, and net sales are $200,000. Its I/S ratio would be $50,000 divided by $200,000 = 0.2, indicating $0.25 in stock for every $1 of sales.
Track this ratio regularly to spot trends in your inventory management. If it increases, look for ways to boost sales, reduce stock levels or both. If it decreases, ensure you have enough inventory to meet customer demand and order more if you need it.
Recommended reading

What is supply chain management and how can it help your business?
Other important inventory sales metrics
Getting your inventory management right means tracking more than just turnover and DSI rates on your balance sheet.
Here’s a quick rundown of other essential metrics, what they measure, why they’re important and how to calculate them:
|
Metric and insight |
How to calculate |
|
Deadstock/spoilage Unsold stock that’s unlikely to sell, including expired or obsolete items |
(unsellable stock / total available stock) × 100 |
|
Inventory shrinkage The difference between recorded inventory and physical stock that is the result of theft, breakage, fraud or loss |
end-of-period inventory value − inventory physically counted |
|
Available inventory accuracy How well your stock records match what stock you physically have available |
(counted items matching inventory records / total counted items) × 100 |
|
Gross margin percent The portion of the selling price that is gross profit |
[(total revenue – cost of goods sold) / total revenue] × 100 |
|
Inventory carrying cost The percentage of inventory value you spend on storage and maintenance (e.g., warehousing, insurance, rent and labor) |
[(inventory service costs + inventory risk costs + capital costs + storage costs) / value of total inventory] × 100 |
|
Lead time The time it takes for customers to receive an order from the point of order |
order processing time + delivery lead time + production lead time |
|
Order cycle time The average time to fulfill a customer order internally (e.g., get it to a courier) |
(when customer received order − time customer placed order) / number of total shipped orders |
|
Stockouts The percentage of time products are unavailable when customers place orders |
(number of days out of stock / 365) × 100 |
|
Fill rate The percentage of orders or items you fulfill from available stock |
[(total items − shipped items) / total items] × 100 |
Monitoring metrics like gross margin provides valuable insights into your financial health. Shrinkage, accuracy and deadstock reflect your operational efficiency, while lead times, fill rates and stockouts directly impact how happy customers are with your service.
To improve your business, focus on the metrics that address your most pressing challenges – like high inventory holding costs, slow sales or regular stockouts. For example, if holding costs are high, adjust the quantity of stock you buy to match your actual sales demand.
Once you’ve resolved each issue, expand your focus to other areas. If you can find the data, compare your results with industry benchmarks to pinpoint opportunities for better performance. Your inventory turnover ratio might be four when the industry average is six, so look for ways to optimize stocking levels and improve sales velocity.
Note: Tracking and improving important sales metrics like sales velocity and conversion rates can help you manage your inventory more efficiently. These metrics show which products sell fast so you can adjust stocking levels to match demand. They also signal to marketing and sales teams which items are in the highest demand, helping them hit their sales targets.
How to use Pipedrive to manage inventory
A customer relationship management (CRM) solution like Pipedrive can effectively handle inventory management for small to medium-sized businesses (SMBs) without specialized and often costly software. The added benefit is you don’t need to onboard teams to a brand-new tool or pay for an extra system.
Here are four ways Pipedrive can support inventory sales management:
1. Leverage the Products feature’s capabilities
Pipedrive’s Products feature lets you create and manage a detailed catalog of your products and services in one place. It’s handy for SMBs with made-to-order items or multiple pricing options.
Go to Tools and apps > Products from the Pipedrive menu to enable the Products feature. Here, you can also set your default tax preferences.
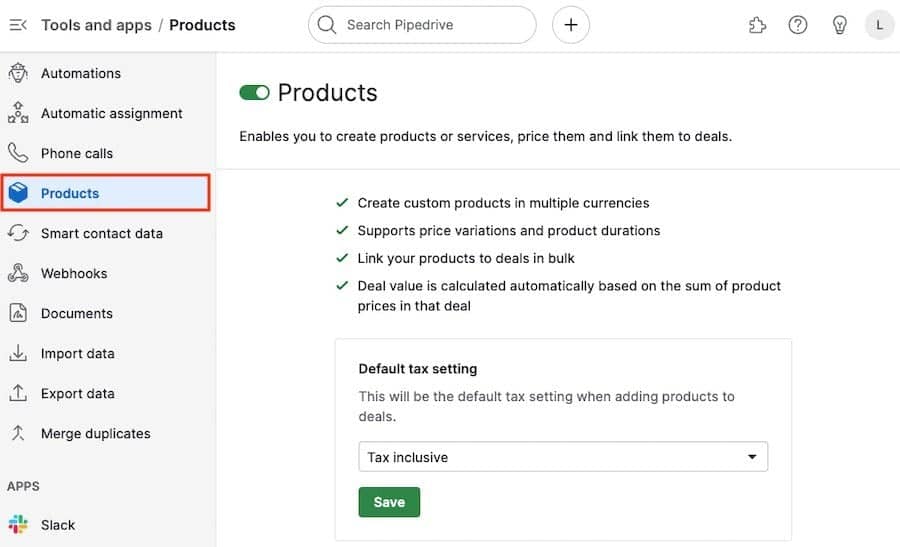
Standout features of the Products tool allow you to:
-
Add product details, including names, prices, codes and tax info
-
Support multiple currencies and price points for the same product
-
Include tax percentages, discounts and promotions
-
Import existing product data directly from spreadsheets
-
Link products to deals for better sales tracking
Products can simplify inventory tracking by integrating Pipedrive with Google Sheets through Zapier.
Zapier bridges Pipedrive and third-party apps like Google Sheets or Microsoft 365 through Zaps – automated workflows triggered by specific events. The integration eliminates the need to enter the same data into different systems and syncs your data in real time.
You can sync products and sales data on a Google Sheet or Excel spreadsheet to monitor stock levels and get the information you need to calculate sales inventory metrics. This type of integration is ideal for smaller businesses, providing a flexible way to track inventory with Pipedrive.
This way, Pipedrive’s Products feature lets you track potential sales, predict future stock needs and streamline your entire sales cycle.
2. Connect to your Shopify store
Connect Pipedrive to your online store with the Shopify app integration to simplify inventory management and sales tracking. This integration automatically syncs your e-commerce data with your CRM system, making it easier to monitor stock levels and analyze sales performance.
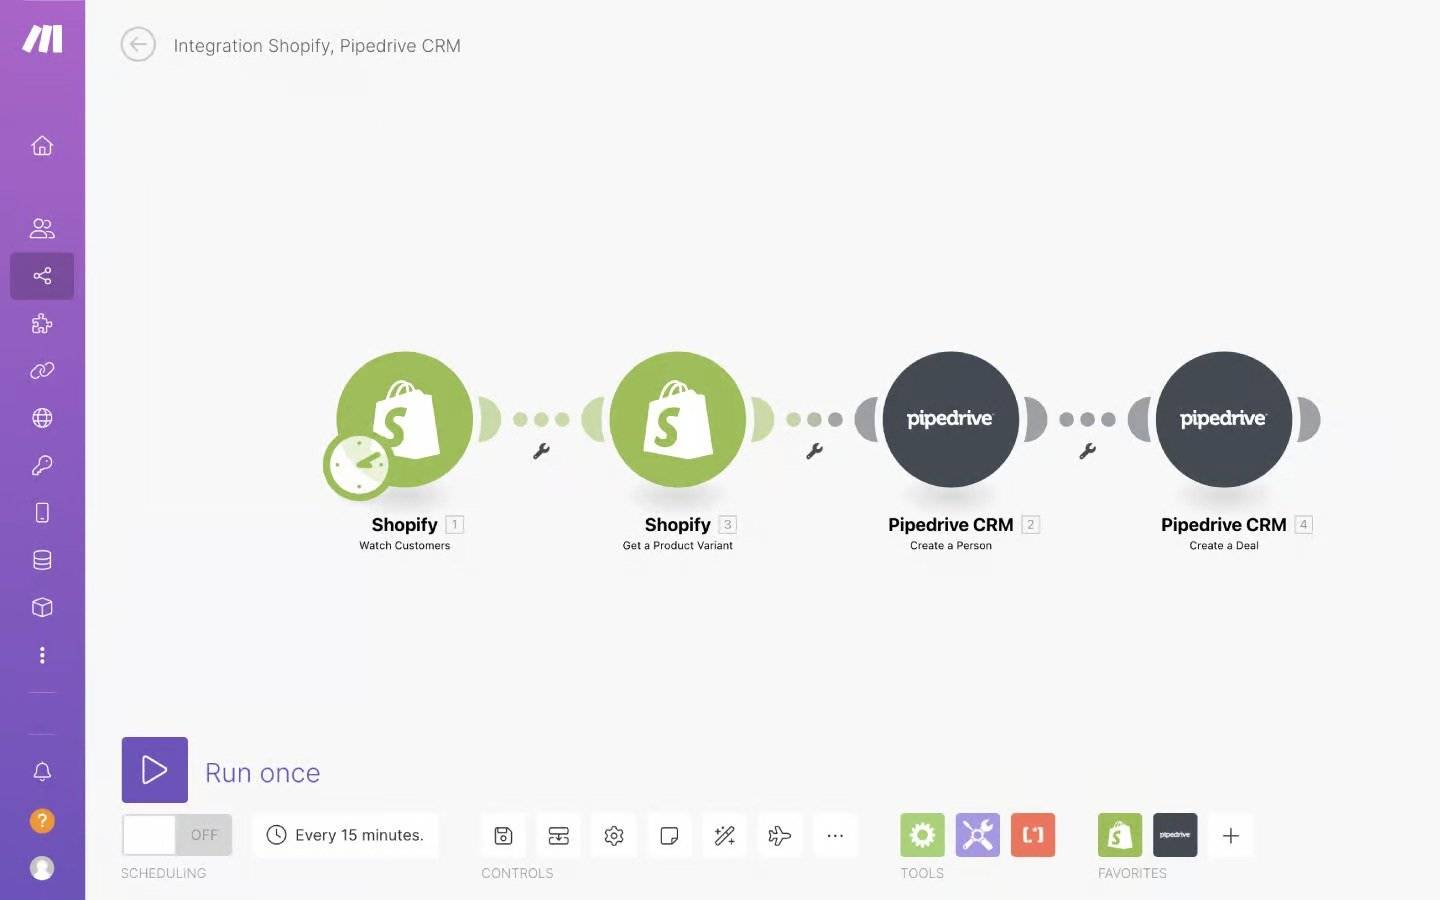
Here’s how it helps:
-
Real-time inventory tracking: get alerts when product quantities run low across all sales channels. You’ll avoid stockouts and maintain a balanced inventory turnover rate.
-
Sales data consolidation: view all your sales data in one place, making it easier to calculate key metrics like inventory-to-sales ratio and gross margin percentage. Track product performance across different channels and locations.
-
Customer insights: use purchase history and preference data to better forecast demand and adjust stock levels, optimizing inventory investment and improving fill rates.
-
Automated reporting: generate reports in Shopify to track inventory metrics over time, helping you monitor sales velocity and stock levels to make smarter purchasing decisions.
Integrating Shopify with Pipedrive gives you the tools to make informed stock management decisions while keeping your sales team updated with real-time inventory information.
Note: The Pipedrive-Shopify integration is particularly valuable for small-to-medium-sized retail businesses that want to optimize inventory across offline and online sales channels.
Integrate your existing inventory management software with Pipedrive
You can connect Pipedrive to Cin7 Core Inventory, SOS Inventory and inFlow Inventory using pre-built integrations from Zapier. By linking Pipedrive to these specialist inventory management tools, you can align your inventory data with your sales pipelines to improve your sales inventory and operations planning.
Pre-built Zaps allow you to:
-
Automatically update inventory levels: when one of your salespeople closes a deal, the stock levels in your inventory system update immediately. Updates prevent overselling and reduce the risk of stockouts.
-
Order completion: once you fulfill an order in your inventory system, Pipedrive automatically updates the client record. The automation keeps your sales and support teams in sync, making follow-ups easier and improving customer service.
-
Share customers: update customer information in either Pipedrive or your inventory software. The changes will sync automatically, avoiding duplication and minimizing errors.
-
Share new products: when you add a product in Pipedrive or Cin7 Core Inventory, it syncs across both platforms. Your sales team gets accurate and consistent information on pricing, availability and product details.
The seamless data flow between Pipedrive and your inventory system, enabled by Zaps, provides real-time insights into key metrics like inventory turnover, stock levels and sales performance. These integrations help you make smarter decisions about restocking, pricing and sales strategies.
Connecting Pipedrive to your inventory management tools helps you save time, reduce manual errors and stay agile when responding to changes in demand, potentially boosting sales performance and customer satisfaction.
Add the MRPeasy integration
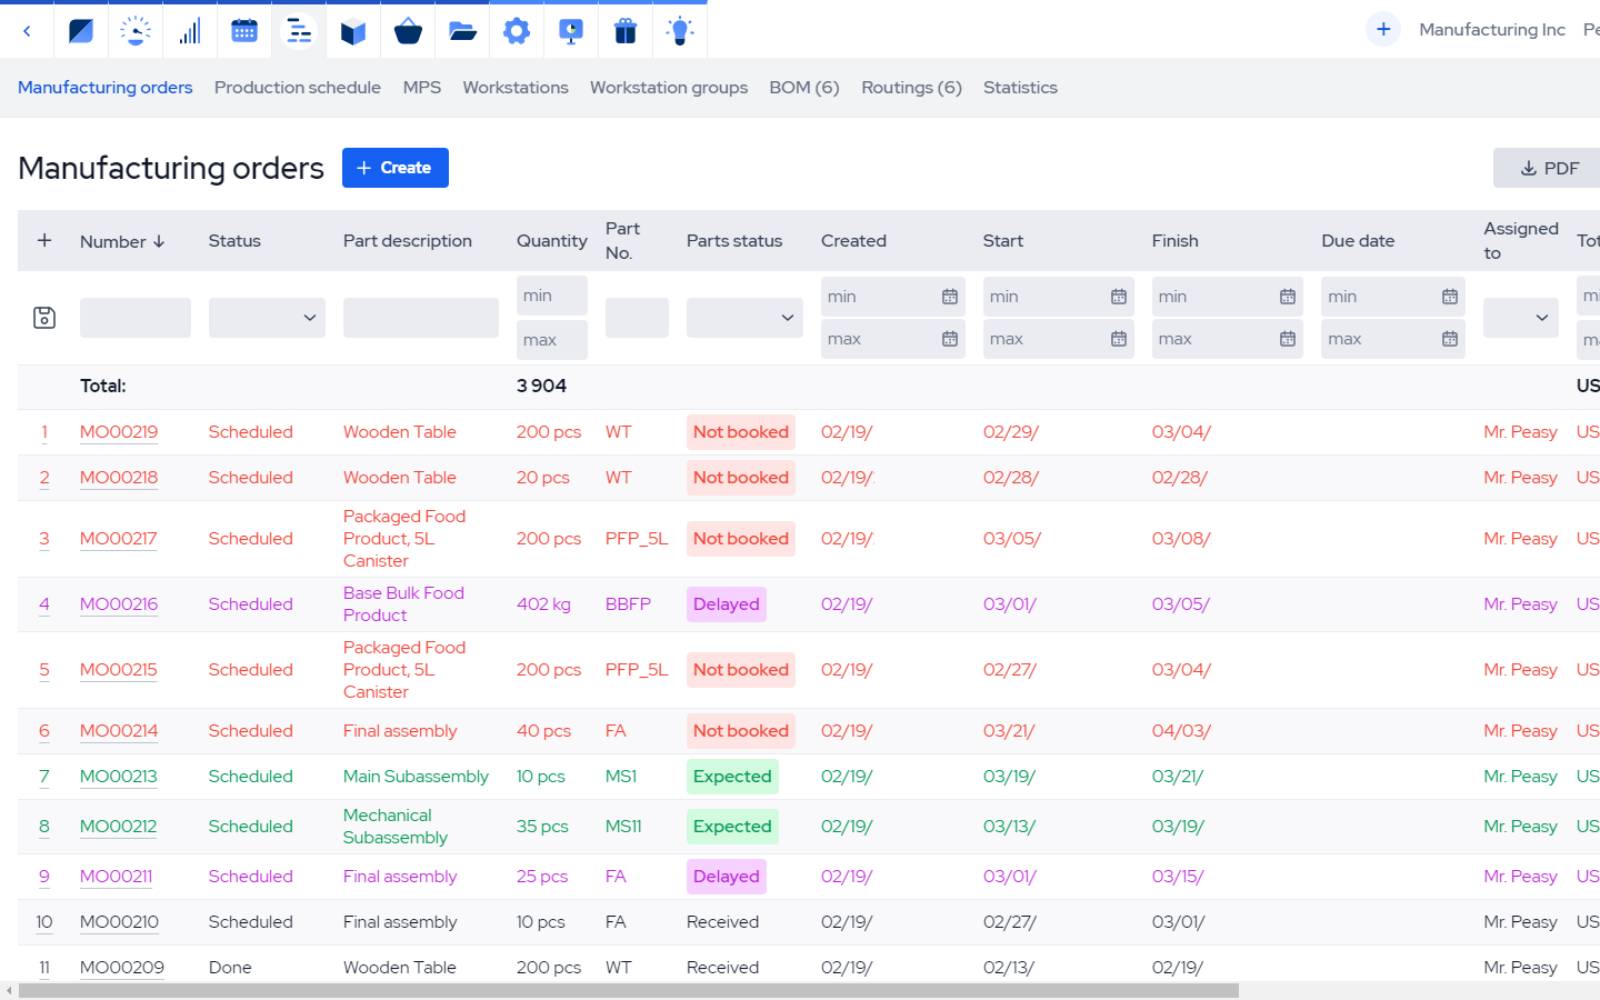
If you already use a tool like MRPeasy, integrate it directly with Pipedrive to seamlessly link your sales and manufacturing processes to create a more efficient workflow. The integration is ideal for small and medium-sized businesses looking to automate their order-to-production process.
When a deal in Pipedrive reaches a particular stage, it automatically converts into a customer order in MRPeasy. The process allows your sales team to focus on closing deals while MRPeasy manages production, inventory, purchasing and order fulfillment.
Here’s how the Pipedrive-MRPeasy connection helps:
-
Automatic updates: as orders move through MRPeasy (e.g., when ready for shipment or shipped), linked deals in Pipedrive update automatically. You can also add notes to keep your sales team updated in real time.
-
Customer and product sync: the integration syncs customer data and product information so your data stays accurate and consistent.
-
Customizable workflow: set actions in Pipedrive that automatically trigger actions in MRPeasy, allowing you to customize workflows to fit your needs.
The MRPeasy integration bridges the gap between sales and production, streamlining operations and improving efficiency. Real-time updates provide visibility at every stage, from production status and inventory levels to order progress and shopping. Your team has the latest information to manage customer inquiries quickly and accurately.
Download your guide to managing teams and scaling sales
The blueprint you need to find a team of superstars and build a strong foundation for lasting sales success
Inventory sales FAQ
Final thoughts
Regularly tracking your inventory sales metrics helps you make smarter stock-buying decisions. Having the right products available for your customers reduces waste and frees up cash for other business needs, giving you greater liquidity to invest in growth.
You can use various solutions – including your CRM’s native features and third-party integrations – to handle your inventory management needs, from simple tracking to more complex operational workflows.
Ready to maximize your inventory management and boost sales? Sign up for a free 14-day Pipedrive trial to stay on top of your stock and sales.
If Pipedrive is of interest and you'd like more information, please do make contact or take a look in more detail here.
Credit: Original article published here.
