Our view at Stack - Pipedrive is a robust CRM platform, offering automation, contact data collection, webhooks, AI-powered sales assistant, email communications, email marketing, and customisable sales pipeline workflows.
For sales and marketing teams, tracking the right metrics helps prove impact, optimize spending and drive growth. Whether you’re running digital campaigns, building brand awareness or boosting sales, these measurements show what’s working and what needs improvement.
In this comprehensive guide, you’ll learn how to measure, track and optimize key marketing metrics to improve your marketing performance, with practical examples throughout.
What are marketing metrics?
Marketing metrics are measurable indicators that assess how well your digital marketing strategies perform. These metrics are directly linked to business outcomes like sales growth and customer engagement.
Think of digital marketing performance metrics as the vital signs of your marketing initiatives’s health. They reveal which strategies resonate with your audience and signal where you may need to adjust course.
For example, conversion rates show the percentage of users who complete a desired action, like making a purchase or signing up for a newsletter. Click-through rates measure how often people click on your ads, emails or links. Both show how engaging and relevant your content is to your audience.
Why tracking marketing metrics is crucial for business success
Tracking digital marketing metrics and key performance indicators (KPIs) creates a clear path between marketing activities and business outcomes. These measurements support strategic planning, helping you allocate resources to the most effective channels.
Here are five ways consistent metric tracking helps you make better marketing decisions.
|
Benefit |
What it means for you |
|
1. Measure ROI and justify marketing spend |
Marketing metrics reveal the financial returns on each dollar spent. They show how sales and marketing campaigns contribute to revenue and impact the bottom line, helping you defend budgets and secure resources. |
|
2. Identify areas for improvement |
Regularly analyzing metrics helps you spot underperforming campaigns and channels before they drain resources. Data-backed insights guide you in optimizing campaigns. |
|
3. Make informed decisions based on data |
Marketing metrics replace gut feelings with hard data, allowing you to make strategic decisions based on actual results. Consistent monitoring reveals patterns that inform smarter campaign choices. |
|
4. Align marketing efforts with business goals |
Clear metrics ensure marketing activities directly support company objectives. Tracking relevant KPIs keeps your campaigns focused on meaningful outcomes. |
|
5. Show marketing’s revenue impact |
Attribution metrics link marketing efforts directly to sales and revenue generation. The direct link to business results builds credibility for the chief marketing officer (CMO) and proves marketing’s value. |
Let’s explore the specific metrics that help you achieve these benefits across your marketing strategy.
Recommended reading

How to set performance-boosting OKRs for sales teams (with 7 examples)
Core acquisition metrics
Core acquisition metrics track how your marketing attracts and converts new leads. These important metrics reveal the true cost and value of acquiring new customers through different marketing channels.
1. Customer acquisition cost (CAC)
CAC = Total Acquisition Costs / Number of New Customers
CAC represents the total cost of acquiring new customers, including marketing spend, sales costs and related overhead. Understanding CAC helps you ensure customer acquisition efforts are sustainable and profitable.
Consider a B2B software company that spent $100,000 on marketing and sales in Q1 and acquired 200 new customers. Their CAC would be $500 per customer ($100,000/200), indicating they need to generate at least $500 in revenue per customer to break even.
Most businesses aim to recover their CAC within 12 months to ensure each sales deal remains profitable. Recovering CAC within a year ensures customer acquisition costs don’t overburden cash flow.
To optimize CAC:
-
Track costs by channel to identify your most cost-effective acquisition methods
-
Test different audience segments to find those with lower acquisition costs
-
Improve conversion rates through landing page optimization
-
Automate repetitive marketing tasks to reduce operational costs
Regular CAC monitoring helps maintain profitable customer acquisition as market conditions change.
Note: In addition to CAC, track cost per acquisition (CPA) – the cost of acquiring each new customer through specific channels or campaigns. Analyzing both gives a clearer view of acquisition efficiency and helps identify which strategies attract new customers at a sustainable cost.
2. Click-through rate (CTR)
CTR = (Number of Clicks / Number of Impressions) x 100
CTR shows how many people take action after seeing your marketing materials. Every click represents someone moving deeper into your marketing funnel, whether from ads, emails or social posts.
Suppose your latest email campaign reaches 10,000 subscribers. 400 people click through to learn more. That’s a 4% email marketing CTR (400/10,000 x 100) – but what makes it good or bad?
Success looks different across channels. A good CTR for an email campaign often hits 2-5% CTR, while the average for Google Ads hovers around 3% for search and 0.46% for display. Your industry and audience type influence these benchmarks.
Boost your CTR by:
-
Crafting magnetic headlines that demand attention
-
Zeroing in on your ideal audience segments
-
Adapting content for each platform’s unique environment
-
Creating clear paths to action
Track click-through rate (CTR) over time to understand your audience’s preferences and create messages that resonate.
3. Conversion rate
Conversion Rate = (Number of Conversions / Total Visitors) x 100
Conversion rates go beyond basic engagement to show how many people take the desired action (e.g., purchasing products, signing up for demos or joining your email list).
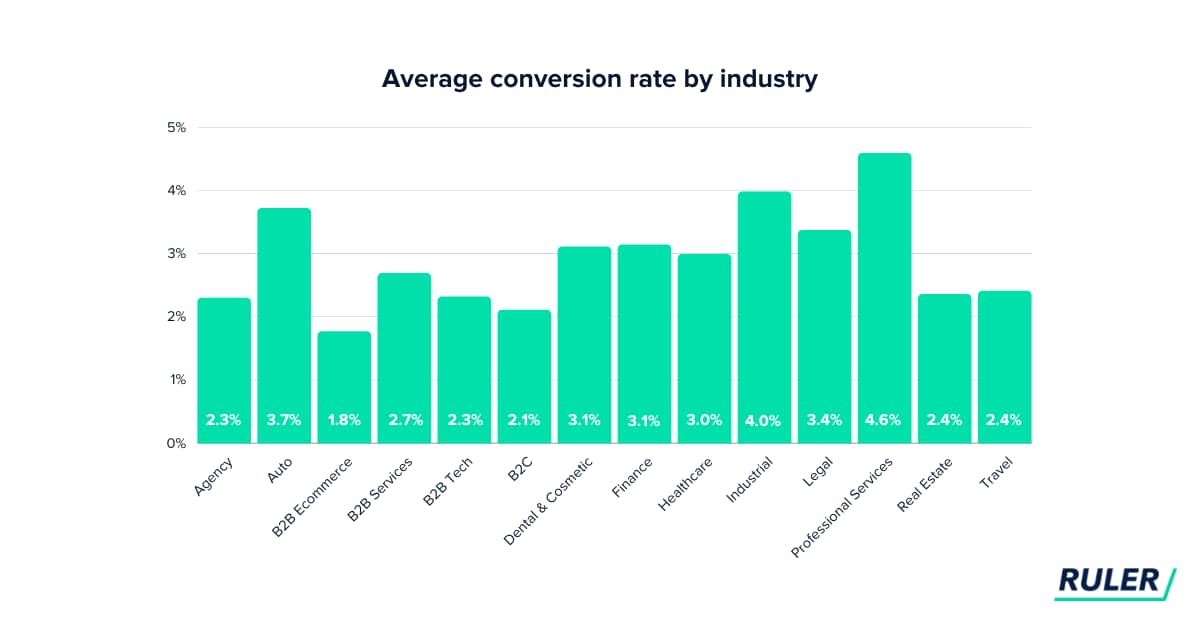
Take an e-commerce site with 50,000 monthly visitors and 1,500 purchases. Their 3% conversion rate (1,500/50,000 x 100) helps decode whether their organic traffic turns into actual business results.
Average conversion rates range by industry.
Improve your conversion rates by:
-
Designing user journeys that guide visitors through the sales process
-
Removing friction points in your process
-
Building trust with social proof and testimonials
-
Running A/B tests to find winning calls-to-action (CTA)
Regular conversion funnel optimization can significantly increase sales. When you understand what converts your audience, you can replicate that success across campaigns.
4. Bounce rate
Website bounce rate = (Single-page Sessions / Total Sessions) x 100
Email bounce rate = (Undelivered Emails / Total Emails Sent) x 100
Think of bounce rates as your first impression scores. For websites, they measure visitors who leave after viewing just one page. For emails, they track messages that never reach their destination.
Suppose a blog post gets 1,000 visits and 650 readers exit without clicking anywhere else. This 65% bounce rate (650/1,000 x 100) signals potential engagement challenges.
Note: Context matters for both metrics. While a high website bounce rate might raise alarms on product pages, it could be normal for blog posts. For emails, soft bounces (temporary email deliverability issues) are less concerning than hard bounces (invalid addresses).
Reduce bounce rates by:
-
Suggesting relevant next steps or related articles
-
Speeding up page load times
-
Creating mobile-friendly experiences
-
Maintaining email hygiene
-
Validating email addresses at signup
Watch bounce patterns across your digital touchpoints. Website bounces reveal which pages need attention, while email bounces help maintain list hygiene and sender reputation.
5. Marketing qualified leads (MQLs)
Not all leads deserve equal attention. MQLs represent your marketing sweet spot.
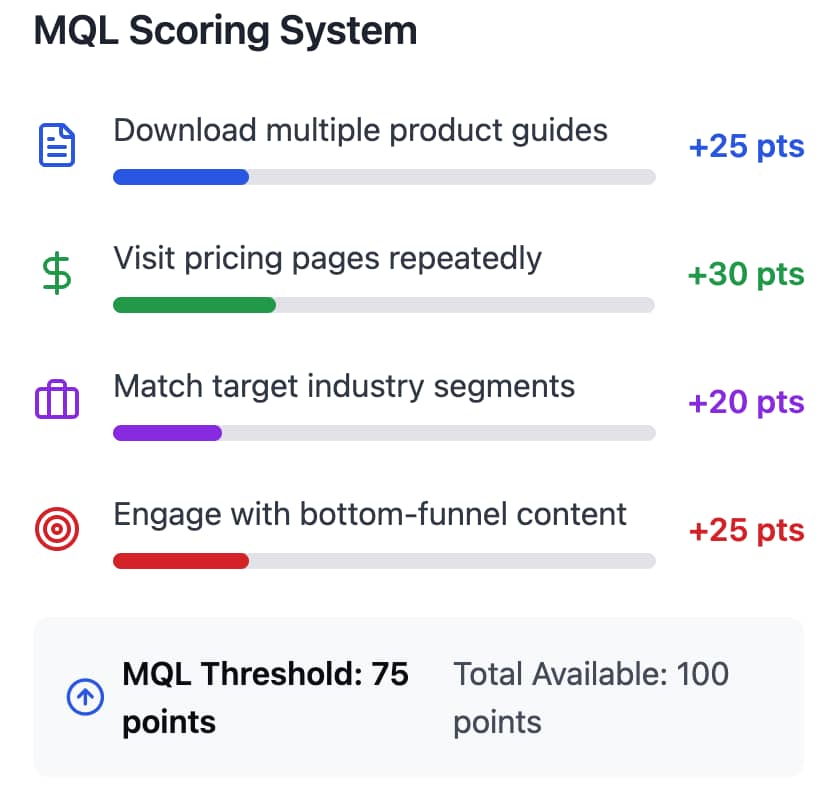
An MQL is a lead that can become a potential customer based on their behavior and profile. Qualifying leads shows you which prospects have moved beyond casual interest. It reveals which have taken specific actions that align with typical buying patterns and match your ideal customer characteristics.
When MQLs show stronger buying intent and engagement, qualify them further as sales qualified leads (SQLs), ready for direct sales outreach.
Identifying MQLs requires a scoring system based on specific actions and attributes. Common scoring criteria include:
-
Engagement behaviors. Email opens, website visits, content downloads, webinar attendance
-
Demographic fit. Company size, industry, geographic location, annual revenue
-
Online activity. Time spent on pricing pages, product documentation views, feature comparisons
-
Form submissions. Demo requests, contact forms, newsletter signups
-
Firmographic data. Job title, department, decision-making authority
-
Buying signals. Budget discussions, competitor comparison requests, implementation questions
For example, a B2B SaaS company might have the following lead qualification scoring system:
Quality beats quantity. Strong MQL identification helps sales teams prioritize outreach and marketing teams refine their targeting strategies.
Find more of the best leads fast with your lead qualification ebook
Learn how to find more of the right leads faster. This 22 page ebook will help you build a scalable lead qualification process for your team.
Effective content marketing automation can help nurture MQLs through the customer journey.
Recommended reading

How to create a client getting system that drives business growth
Customer value and retention metrics
Customer value and retention metrics reveal the lifetime value of your customer relationships. Tracking customer value over time helps you make strategic decisions about acquisition costs, retention programs and growth.
6. Customer lifetime value (CLV)
CLV = Average Purchase Value x Purchase Frequency x Average Customer Lifespan
CLV predicts the total revenue you can expect from a single customer relationship. It pinpoints how much you can spend to acquire and retain customers while staying profitable.
Key factors affecting CLV:
Track CLV trends to spot opportunities for extending customer relationships and increasing their value over time.
7. Customer retention rate
Retention rate = ((End Customers − New Customers) / Start Customers) x 100
Customer retention rates show the percentage of customers who stick with your business over time. It’s a loyalty indicator that tells you how well you maintain relationships after the initial sale.
Picture a subscription service starting in January with 1,000 customers. By December, they had 850 total customers, including 150 new customers that year.
Their retention rate? 70% ((850−-150)/1,000 x 100). This means they kept 70% of their original customers.
Note: Industry benchmarks for customer retention vary widely: SaaS companies have a 68% retention rate, while hospitality and travel companies have a 55% retention rate. Compare your rates to direct competitors in your sector for meaningful insights.
Boost your retention by:
-
Creating personalized customer experiences
-
Building strong onboarding programs
-
Gathering and acting on feedback
-
Rewarding customer loyalty
Monitor retention patterns monthly or quarterly. Each percentage point improvement compounds over time, often contributing more to growth than new customer acquisition.
8. Purchase frequency
Purchase frequency = Total Number of Orders / Total Number of Unique Customers
Purchase frequency shows how often customers come back to buy within a specific timeframe. It reveals the strength of your customer engagement and product-market fit.
Typical rates shift across industries. For example, a coffee shop might see weekly visits, while B2B software could have annual renewal cycles.
Drive higher frequency and boost sales through:
-
Smart product recommendations
-
Timely reorder reminders
-
Loyalty programs that reward repeat purchases
-
Seasonal promotions aligned with buying cycles
Watch purchase patterns over time. Understanding these rhythms helps you time marketing campaigns and inventory decisions for maximum impact.
9. Repeat purchase rate (RPR)
RPR = Number of Returning Customers / Total Number of Customers x 100
Repeat purchase rates measure the percentage of customers who make additional purchases after their first transaction.
A SaaS company tracking customer subscriptions finds that out of 1,000 total customers, 650 renewed their subscription for a second year. Their RPR would be 65% (650/1,000 x 100), suggesting strong product satisfaction and effective customer retention.
To improve RPR:
-
Create personalized post-purchase communication
-
Develop customer loyalty programs
-
Monitor customer satisfaction scores
-
Address common causes of customer churn
-
Optimize the customer onboarding process
Regular RPR analysis provides opportunities to strengthen customer relationships and increase lifetime value.
Recommended reading

Learn the tried-and-true techniques to get sales referrals
Digital engagement metrics
Digital engagement metrics measure how users interact with your online presence across websites, social media and digital campaigns. Understanding customer interaction management patterns across digital channels helps optimize the user experience.
10. Website traffic
Website traffic measures the total number of users visiting your site within a specific timeframe. Beyond raw visitor counts, analyze traffic sources (organic, direct, referral, social), page views and user behavior patterns.
Web visitor tracking metrics include:
-
Unique visitors vs returning visitors
-
Average time on site
-
Pages per session
-
Traffic sources (organic, direct, referral, social)
-
Mobile vs. desktop usage
Search engine performance and SEO strategies boost organic traffic by improving your site’s visibility and ranking in search results.
You can also upgrade your traffic insights with Pipedrive’s Web Visitors add-on. It reveals which organizations are viewing your site as well as their entry points and engagement patterns.
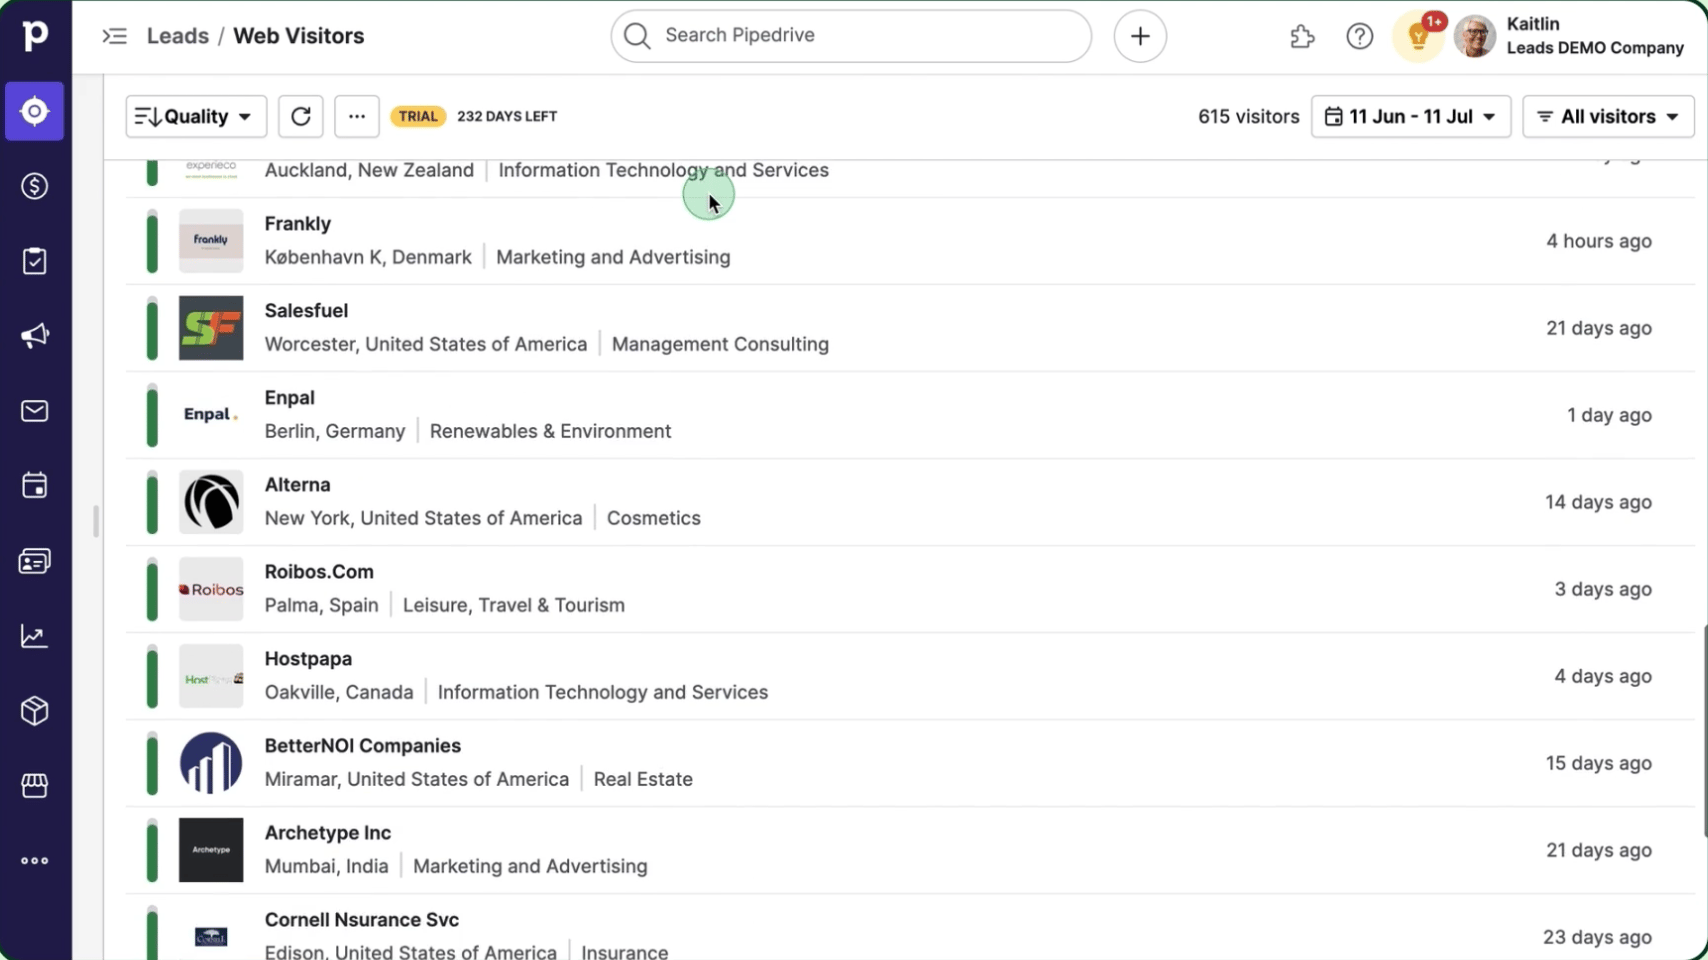
Features include:
-
Automatic visitor ranking based on activity
-
Filtering by country and AdWords campaigns
-
Complete company browsing history
-
Lead behavior analysis for sales targeting
You can also connect Google Analytics to your website to automatically track and visualize all these metrics in customizable dashboards.
Track these metrics monthly to spot trends and identify which marketing channels drive quality traffic to your site.
11. Engagement rate
Engagement rate = (Total Engagements / Total Reach) x 100
The engagement rate measures how actively your audience interacts with your content through likes, comments, shares and clicks. It pinpoints content relevance and audience connection more accurately than follower counts.
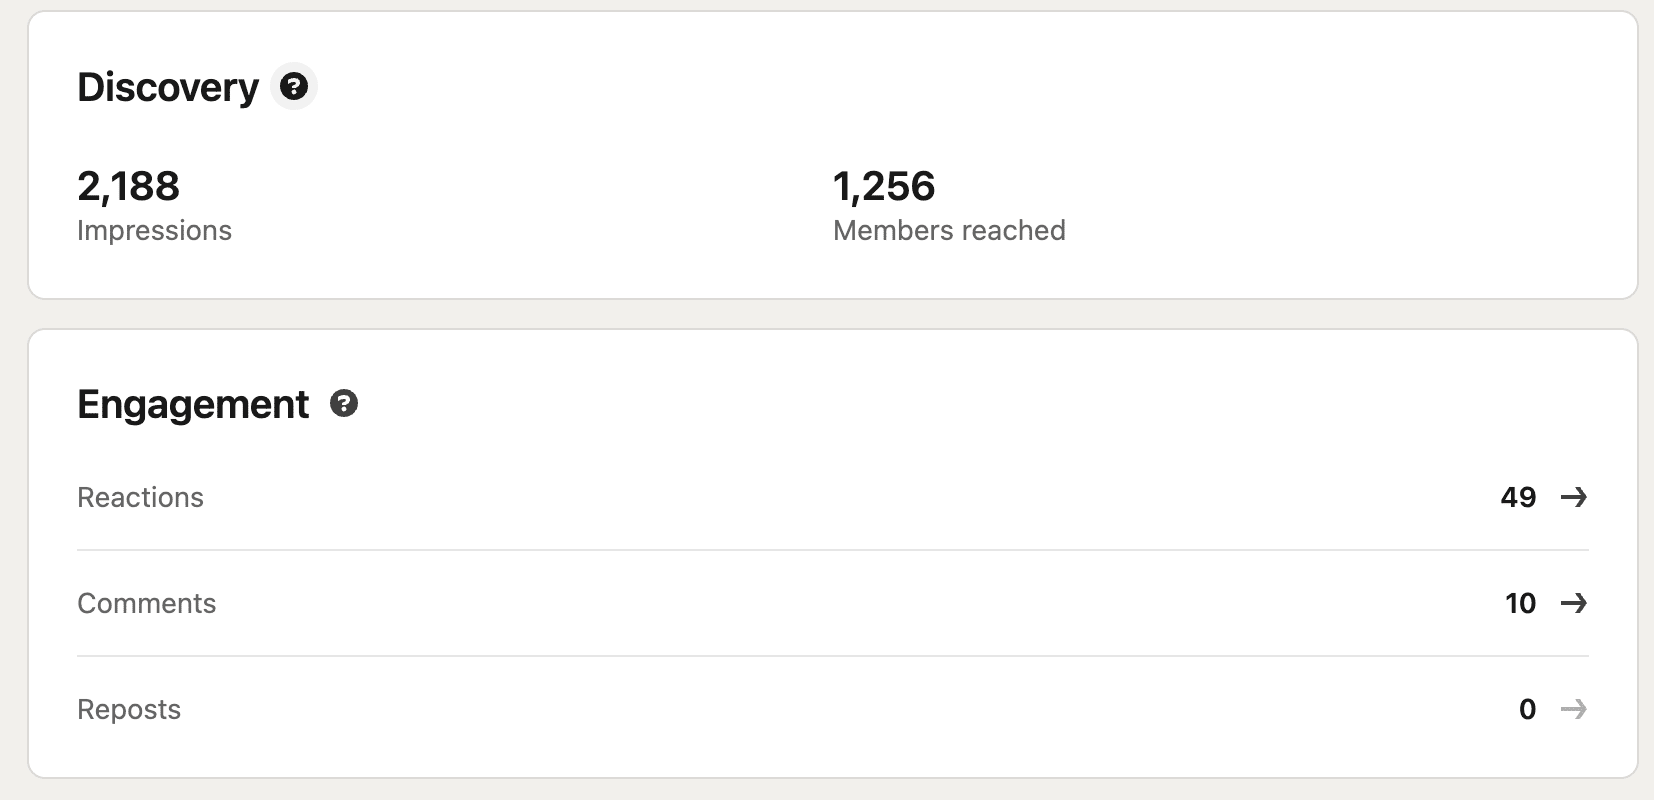
For example, a brand’s LinkedIn post reaching 1,256 people and receiving 59 interactions (49 likes, 10 comments) would have a 4.7% engagement rate (59/1,256 x 100).
Track engagement rates by:
-
Post type (images, videos, text)
-
Publishing time
-
Content topic
-
Platform (LinkedIn, Instagram, Twitter)
-
Campaign or organic content
Pipedrive’s Email Analytics and Reporting provide real-time alerts when contacts open emails or click links.
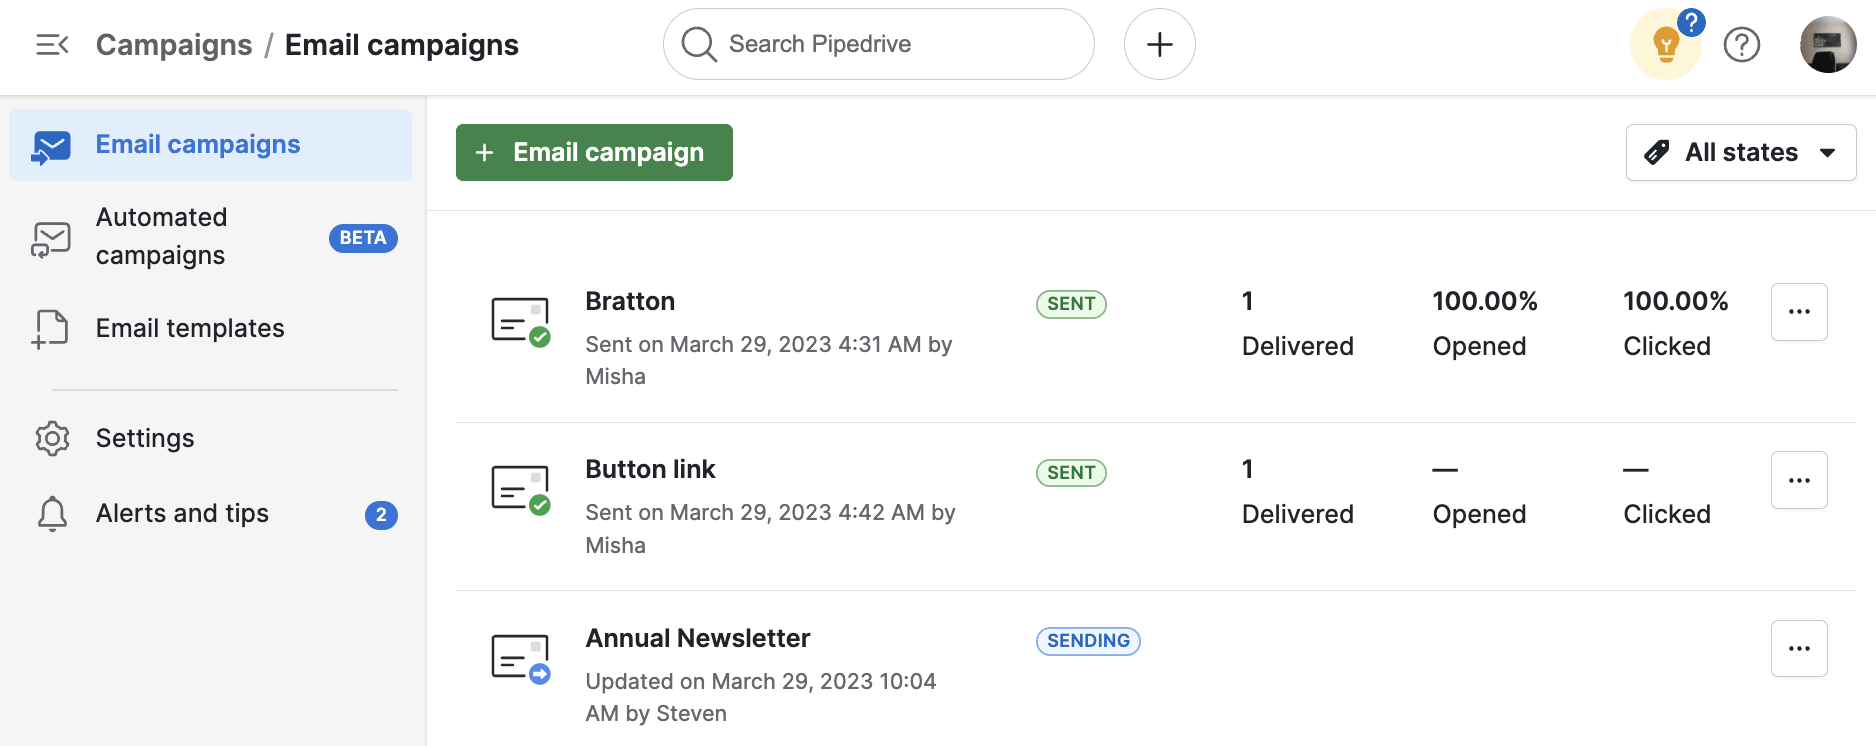
These email engagement metrics help you identify the most engaged prospects, time follow-up communications and test different email formats.
Track email performance over time and by location to optimize your content strategy and posting schedule for maximum audience response.
12. Time on site
Average time on site = Total Time Spent / Number of Sessions
The amount of time visitors spend on your website reveals deeper insights than simple page views. Time on site separates casual browsers from interested prospects.
Content quality plays the biggest role in keeping visitors engaged. For example, when users spend four minutes exploring product pages but bounce quickly from blog posts, it signals where your content strategy needs attention.
Several factors influence how long people stay, including:
-
Relevant, valuable content
-
Quick-loading pages
-
Intuitive navigation
-
Mobile-friendly design
-
Engaging interactive elements
Google Analytics breaks down time on site by landing page, traffic source and device type.
Look for patterns in the data. For instance, pages with longer visit times often indicate content that resonates with your audience’s needs. Use these insights to replicate success across your site.
13. Page views per session
Pages/Session = Total Page Views / Total Sessions
Page views per session show how deeply users explore your content before leaving.
A high number of page views often indicates strong internal linking and compelling content flow.
For example, when an e-commerce site sees users visit an average of six pages per session instead of two to three, it suggests visitors are actively researching products and moving through the sales funnel.
Your site structure impacts browsing behavior. Include these elements:
-
Clear navigation menus
-
Related content suggestions
-
Strategic internal links
-
Compelling calls-to-action
-
Smooth category transitions
Track where sessions typically end to identify potential roadblocks in the user journey. Higher page views correlate with better chances of conversion, but quality matters more than quantity. Focus on creating meaningful paths through your content rather than just adding more pages.
Recommended reading

Sales lead generation: Tools and techniques to power up your pipeline
Brand performance metrics
Brand metrics measure how your target audience perceives, remembers and connects with your company. These indicators help quantify the often intangible aspects of brand building, from initial recognition to lasting loyalty. Understanding brand performance metrics guides strategic decisions about brand positioning and marketing investments.
14. Brand awareness
Brand awareness measures how familiar your target audience is with your brand. This foundational metric indicates market presence and memory retention.
Calculate brand awareness through:
-
Surveys measuring unprompted recall
-
Social media brand mentions
-
Direct website traffic volume
-
Search volume for brand terms
-
Share of voice in industry conversations
For context, rising brand awareness typically leads to easier customer acquisition and lower marketing costs. Track these numbers quarterly to understand how marketing campaigns and PR efforts impact brand recognition.
15. Share of voice
Share of Voice = (Your Brand Mentions / Total Industry Mentions) x 100
Share of voice measures your brand’s presence in market conversations compared to competitors. It shows your relative visibility across social media, news coverage and industry discussions.
Track share of voice through:
-
Social media mentions
-
Press coverage
-
Online reviews
-
Industry forums
-
Search volume
Monitor these numbers monthly alongside sentiment analyses. A rising share of voice with positive sentiment suggests your brand message resonates, while negative sentiment signals a need to adjust your communication strategy.
16. Brand sentiment
Sentiment Score = (Positive Mentions − Negative Mentions) / Total Mentions x 100
Brand sentiment reveals how people feel about your brand, not just how often they talk about it. It’s an emotional measurement metric that predicts future customer behavior and brand health.
Sentiment analysis tools scan conversations across:
-
Customer reviews
-
Social comments
-
Support tickets
-
Survey responses
-
Media coverage
Track sentiment changes around specific events, product launches or campaigns. Quick drops in positive sentiment demand immediate attention, while gradual improvements suggest your brand strategy works.
Note: Neutral mentions matter too. They represent opportunities to create stronger positive associations with your brand.
17. Social media reach
Organic Reach Rate = (Post Reach / Total Followers) x 100
Social media reach measures how many unique users see your content across social media marketing platforms.
Key reach indicators include:
Look beyond raw reach numbers. High reach with low engagement might mean you’re reaching the wrong audience. Focus on growing reach within your target market segments where engagement proves content relevance.
Recommended reading

What is brand positioning: The ultimate guide with 4 examples
ROI and financial metrics
Marketing ROI metrics translate marketing activities into measurable financial value. They show their direct contribution to business growth and profitability. Proving this impact secures continued investment and aligns marketing goals with overall business objectives.
18. Return on investment (ROI)
Marketing ROI = [(Revenue from Marketing − Marketing Costs) / Marketing Costs] x 100
ROI reveals how much revenue your marketing activities generate compared to their cost. Every business owner needs to understand marketing ROI to prioritize marketing channels and inform budget allocation.
Don’t confuse ROI with ROAS (Return on Ad Spend). While ROAS looks only at advertising costs and direct sales revenue, ROI includes all marketing costs (staff time, tools, overhead) and total revenue impact.
Track ROI by:
-
Marketing channel
-
Campaign type
-
Customer segment
-
Product line
-
Time period
Compare ROI across different marketing activities to optimize your marketing mix and focus resources on your most profitable strategies.
19. Ad spend efficiency
ROAS (Return on Ad Spend) = Revenue Generated / Ad Spend x 100
Every dollar spent on advertising should work hard for your business. Understanding ad spend efficiency helps eliminate waste and amplify what’s working in your campaigns.
Let’s look at the real impact: when a retail brand invests $1,000 in social ads and sees $4,000 in direct sales, that 400% ROAS (4,000/1,000 x 100) shows their message hits home with the right audience.
The story becomes clearer when you segment performance across:
-
Platform (Google, Meta, LinkedIn)
-
Ad format (Search, Display, Video)
-
Audience targeting
-
Geographic location
Success comes from constant refinement – pause what’s not working, scale what is and never stop testing. Markets change quickly, and your most efficient ad spend strategy should evolve just as fast.
20. Revenue attribution
Multi-Touch Attribution Model = % Credit Assigned to Each Marketing Touchpoint
Not all revenue paths look the same. Revenue attribution connects specific marketing touchpoints to closed deals, revealing which activities drive sales.
Consider a $10,000 deal that started with a LinkedIn ad, developed through three blog visits and closed after a webinar. First-touch attribution gives LinkedIn full credit, while multi-touch splits credit across each interaction – painting a more complete picture.
Modern attribution looks at:
-
First click impact
-
Last click value
-
Content influence
-
Time to conversion
-
Path complexity
Note: Digital channels make tracking easier, but don’t overlook offline touchpoints like sales conversations, industry events, direct mail and word of mouth.
Build attribution models that match your sales cycle. B2B companies with longer cycles need different attribution windows than e-commerce brands with quick purchases.
21. Cost per lead
CPL = Total Marketing Spend / Number of Leads Generated
Every lead has a price tag. Cost per lead reveals what you’re spending to fill your sales pipeline and helps balance growth with budget constraints.
Lead costs vary by:
-
Marketing channel
-
Industry sector
-
Target audience
-
Lead quality
-
Geographic region
Smart CPL optimization means tactics like testing different channels, refining audience targeting and improving landing pages.
A higher CPL that brings better-qualified leads often delivers more value than cheap leads that never convert. Track both CPL and lead-to-customer conversion rates to get the full story.
Recommended reading

Create an effective marketing automation strategy and improve your ROI
How to track and analyze marketing metrics with Pipedrive
Effective measurement starts with proper setup and consistent monitoring. Here’s how Pipedrive helps marketing teams create a structured approach to tracking metrics and acting on insights faster:
-
Customizable dashboards. Monitor the progress of metrics that matter most to your business, from lead generation to conversion rates. Get a complete view of your market position through competitor analysis, attribution and market research reports.
-
Email marketing tracking. Track email analytics like open rates, click-throughs, unsubscribe rates and engagement patterns in real time. Get instant notifications when prospects interact with your emails and optimize your messaging based on performance data.
-
Integrations through Pipedrive Marketplace. Connect your marketing tools in one place with the Google Analytics Connector integration. See how different channels work together and share insights across teams through shareable dashboards.
-
Goal tracking frameworks. Link your daily marketing activities to quarterly business objectives. Build measurement frameworks that tell meaningful stories about your marketing impact and ROI.
-
Automated reporting. Keep teams aligned with scheduled weekly, monthly and quarterly sales reports. Spot trends early and get fresh insights delivered automatically when you need them.
Note: Before setting up your tracking system, audit your data collection points and privacy compliance. Many regions require explicit user consent for tracking, and tools like Google Analytics need proper configuration to exclude internal traffic and development environments.
Your tracking system should grow with your business needs. Regular lead reporting helps teams spot trends and opportunities early.
Final thoughts
Metrics are essential tools for guiding strategic choices, but they should support – not dictate – your approach to meeting customer needs. Let data inform your marketing, but keep your primary focus on creating meaningful value for your customers.
Start measuring what matters today. Try Pipedrive with a free 14-day trial to turn raw data into actionable insights that drive sustainable growth.
If Pipedrive is of interest and you'd like more information, please do make contact or take a look in more detail here.
Credit: Original article published here.
