You can track and analyze almost everything in marketing to measure performance. What you do with the data sets you apart from the competition.
The best marketers use marketing reporting to turn numbers into actionable insights that shape strategies and grow businesses.
In this article, we’ll explain marketing reporting and the different types of reports used for data-driven decision-making. We’ll also provide tips and tools for creating engaging reports.
What is marketing reporting?
Marketing reporting is the process of collecting and presenting marketing data to make informed decisions about your marketing campaigns and strategy.
Reports provide a snapshot of your key performance indicators (KPIs) for one or more sources over a set period. Agencies use them to update clients on marketing activities, and internal teams use them to show how their marketing efforts benefit company performance.
The data in a marketing report helps answer important questions like:
-
Did the marketing campaign help us achieve our goal?
-
What does our target audience expect from us?
-
Are we getting value from our marketing spend?
-
Which marketing tactics and channels should we invest in going forward?
-
How can we fix an underperforming campaign?
Using this information, teams can tweak current campaigns and plan upcoming initiatives to increase engagement, get more leads and close more sales.
Getting to this point, though, requires the right data presented in the right report. Let’s explore the different options.
3 types of marketing reports and when to use them
There are many reports, each with a different purpose. The type you need depends on what you need to communicate and how often.
For example, if you head up an internal marketing team, stakeholders might want to see a general marketing performance report each quarter. If you’re a marketing agency running an email campaign, your report should only focus on this area.
Here are three categories of marketing reports and their use cases.
1. General marketing reports
General marketing reports help you stay on top of marketing efforts and spot trends.
They provide a big-picture view of all relevant marketing activities and the overall marketing return on investment (ROI). Giving stakeholders a high-level overview helps them see how effective (or ineffective) a current strategy is and plan future activities.
How often you run a general marketing report depends on what you want to report on. Here are some guidelines:
|
Frequency of general marketing report |
When to use it |
| Weekly marketing reports |
To track and analyze short- to medium-term marketing activities to find out:
|
|
Monthly marketing reports |
To see the impact of longer-term marketing initiatives like content marketing, search engine optimization (SEO), pay-per-click (PPC) and public relations (PR). Monthly data is big enough to spot changes in trends and get accurate projections on: |
|
Quarterly marketing reports |
To show long-term trends and changes in key metrics and conversion rates over time. Quarterly reports show how tactics contribute to overall goals for clients or stakeholders who aren’t involved in day-to-day activities. |
|
Annual marketing reports |
To review overall marketing data and key takeaways for the year. Use an annual report to show monthly trends in relation to different tactics and spending. For example, did sales increase when you upped advertising spend |
|
Daily marketing reports |
To spot changes or threats and react quickly. Daily reports are useful in the first few weeks of a campaign. They help internal team members see how websites, email, ads and social media accounts perform. So you can prioritize tasks and resources to make adjustments. |
2. Campaign-specific marketing reports
Reports focusing on one area of your marketing help you explain data independently of broader marketing activities. Digging into individual initiatives allows you to make changes and gain actionable insights for your next campaign, which is useful for promoting a new product, service, offer or event.
For example, say your team ran a Black Friday campaign that included:
At the end of your campaign, you can gather the most important metrics and show how each channel contributed to your goal.
You can also provide monthly or quarterly reports to update stakeholders on ongoing campaigns.
3. Channel-specific marketing reports
If you have a significant marketing presence across multiple channels, creating separate reports prevents information overload and makes data easier to digest.
Channel-specific reports also add context to general marketing reports and examine how a channel has contributed to marketing and business goals.
For example, you might show overall paid search traffic and clicks in a general report. In your channel-specific report, you might break down clicks by device and text ads versus shopping ads.
Analyzing these extra layers in data helps you better understand your audience so that you can run future campaigns that meet their needs.
Channel-specific reports are often presented weekly, monthly or quarterly, like general reports.
Common channel-specific marketing report examples include:
-
SEO marketing reports track organic traffic, ranking positions, backlinks, technical SEO and keyword performance
-
Pay-per-click marketing reports track the number of ad clicks, converting clicks, conversion rate and cost, ad position and ad visibility
-
Social media marketing reports track audience demographics, engagement rates, reach and conversion rates across your social media platforms
-
E-commerce marketing reports track conversion rate, pages per session bounce rate, transactions and average order value
-
Email marketing reports track the number of emails sent, opened and clicked, as well as conversion metrics like rates for click-through, spam, bounce and unsubscribe
Note: You can find email marketing data (and generate tailored reports) with Pipedrive’s Campaigns Insights.
What should your marketing report include?
A marketing report can be a PDF document, dashboard, slides or spreadsheet. The right option depends on how your audience consumes the data.
For example, if you’re presenting data to stakeholders or clients in person, a visual presentation can be an excellent way to keep them engaged. A marketing team is likely more used to analyzing a marketing reporting dashboard or PDF.
What doesn’t change are the foundations. Regardless of format, make sure your marketing report includes the following elements.
A clear title
What is your marketing report about? A clear title gives people an idea of what they’re about to learn and helps them decide if it’s relevant.
A title doesn’t need to be anything creative or clickbait-driven. Instead, focus on intent. Here’s a simple framework to follow:
[Specific topic] Report: [Reporting Period]
For example, Email Marketing Conversion Report: Q3, 2024
Summary of goals and key points
Start your report with a reminder of business goals – this is your “why”. It helps people understand what marketing plans to achieve and the reasons for doing it. The data in the report will show how marketing for the reporting period contributed to goals.
Common marketing-related business goals include:
Next, summarize the key findings. Include what you accomplished and where you fell short. Highlighting newsworthy information gives people a snapshot of what you’ll cover in the rest of the report.
Here’s an example of a digital marketing report summary by SlideTeam:
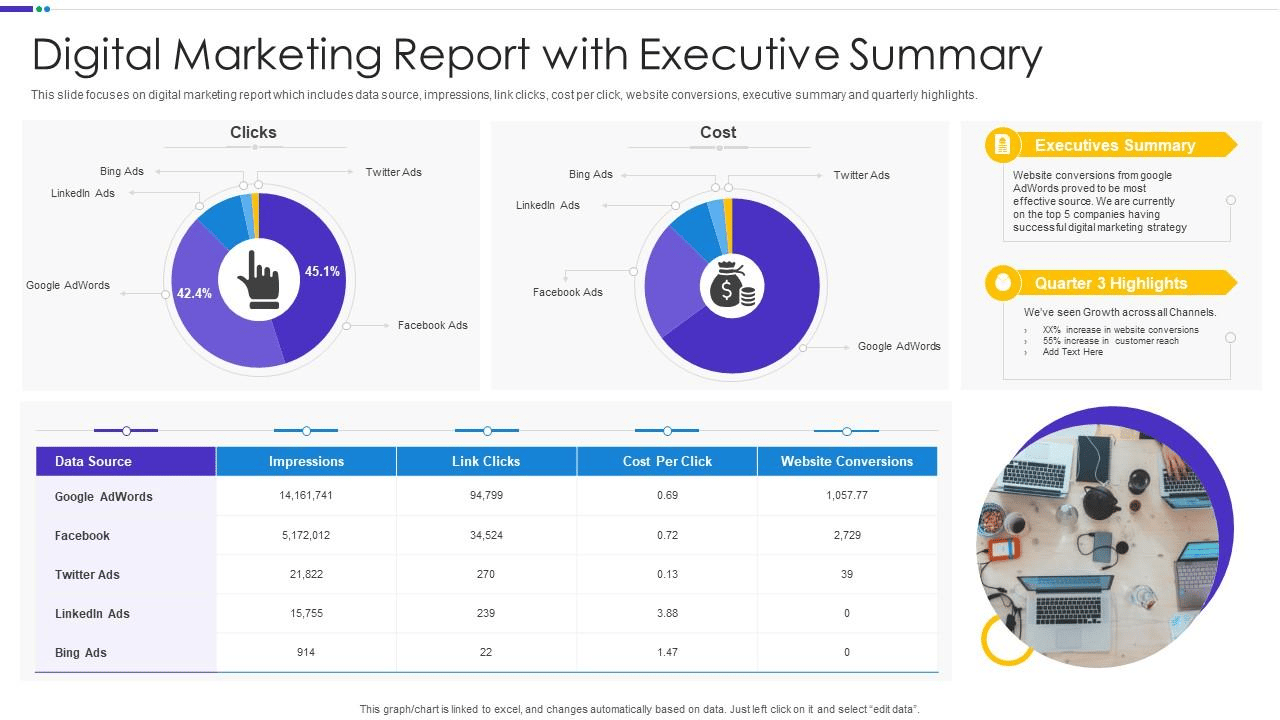
The summary is at the start of the extended report, so it acts as a “too long; didn’t read” (TL;DR) for anyone who wants the key information.
Marketing KPI data
Data makes up the bulk of your report. KPIs should relate to your marketing goal and the decisions you want to make. They’ll likely fall into one of the following categories:
| Types of Marketing KPIs | Example KPIs to include in a report |
|
Marketing tactic KPIs Used to report marketing campaigns or channel performance. |
|
|
Marketing optimization KPIs Used to report specific elements and tactics (e.g. call-to-action buttons or landing page conversions). |
|
|
Marketing strategy KPIs Used to decide the direction of your marketing strategy, including which channels to use and what budget to allocate. |
How do you decide which KPIs to include? Reverse engineer the process. Start with the purpose of your report and work backward.
For example, if you aim to advocate for a larger marketing budget for email marketing, focus on marketing tactic KPIs like engagement rate and conversion rate to show effectiveness.
Recommended reading

A beginner’s guide to common marketing abbreviations
Context of what numbers mean and why they matter
If data is open to interpretation, explain what it means. Without context, numbers don’t tell the whole story. Worse, they can tell the wrong story.
Take this organic search chart from one of the digital marketing reports by the management consulting agency Merkle:
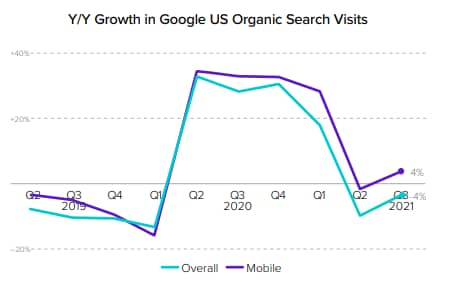
If you take the data at face value, there appears to be a worrying drop-off in search visits. It raises questions like:
-
Is the marketing team failing?
-
Are there problems with our website or products?
-
Is search worth investing in?
By adding context, Merkle explains the reason: marketers in retail were up against tough year-on-year competition after tremendous growth during the COVID-19 pandemic. Given the competition, recent growth in the chart is positive.
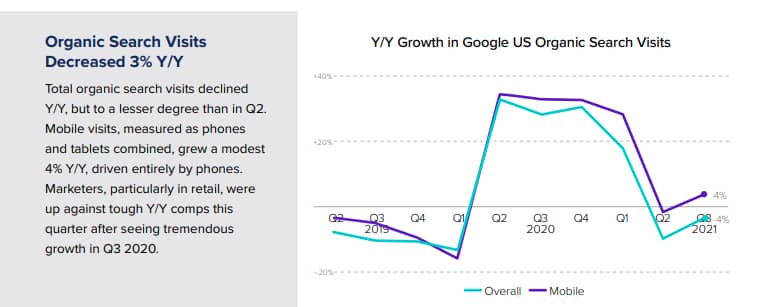
Use context to give stakeholders (particularly those outside the marketing department) an accurate picture of your marketing.
6 tips for creating insightful marketing reports
A marketing report is data-heavy but doesn’t have to be boring. Here are six high-level tips for creating informative and engaging reports.
1. Know your audience
Marketing reports must address audience needs. Before gathering data, think about your reason for creating the report. Here are some questions to ask yourself:
If you’re unsure of your audience’s needs, ask them what decisions they need to make. Clarifying the end goal makes it easier for them to run the numbers that matter to them.
2. Choose metrics that fit the goal
A good marketing report focuses on the data needed for decision-making and action. You don’t need to include everything.
Avoid metrics that don’t directly relate to the audience’s goals. Otherwise, you risk distracting or overwhelming people with irrelevant information.
For example, if the goal of a social media campaign is to capture demand, including data on Facebook likes is unlikely to help you make actionable decisions. Better KPIs to focus on are click-through rate and conversion rate. Both show the impact of content.
To choose metrics that matter, ask yourself these questions:
-
Is the metric measurable across the period?
-
Is it relevant to campaign performance?
-
Can we collect data to calculate the metric in future weeks and months?
-
Is it linked to revenue, growth or engagement?
3. Stick to one idea per page
The one idea (or one thing) per page principle is commonly used in web design to remove distractions and improve conversions. Applying the same approach to marketing reports enhances data processing.
When building its forms, GOV.UK says that starting with one thing on a page helps people:
-
Understand what you’re asking them to do
-
Focus on the specific question and its answer
-
Find their way through an unfamiliar process
Focusing on a single thing at a time will yield the same benefits. A simple way to do this is to divide your marketing report into sections or chapters.
For example, focus one section of a campaign marketing report on email marketing and another on Google ads. Don’t mix data that doesn’t naturally relate.
4. Speak your audience’s language
Avoid obscure or pretentious language in your marketing reports. Jargon can confuse your audience, causing the point you’re trying to make to get lost.
The only exception is if you’re sure the audience understands the jargon.
For example, your marketing team will likely understand terms like “backlinks” or “click-through rate” in an internal report. But those same terms might confuse a CEO.
If you’re creating a marketing report for a mixed audience, consider splitting it into two reports with relevant data and language for each group.
Recommended reading

94 business abbreviations and what they mean
5. Visualize data to tell stories
Data visualization turns numbers into compelling insights. Graphs, charts and other visuals also make complex data easy to digest and remember.
Your reporting tools or CRM will visualize data for your reports. For example, this bar chart from a Pipedrive campaign performance report helps people understand email open rates for each quarter faster than a text-only description.
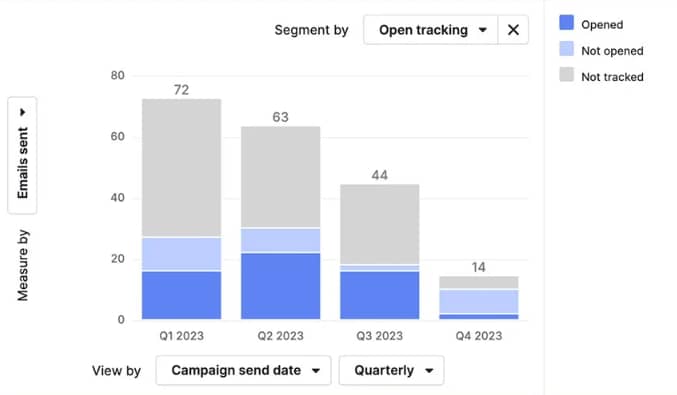
There’s a fine line, though. A chart that contains too much information can confuse your audience. For instance, this example of a pie chart by SR Analytics leaves more questions than answers.
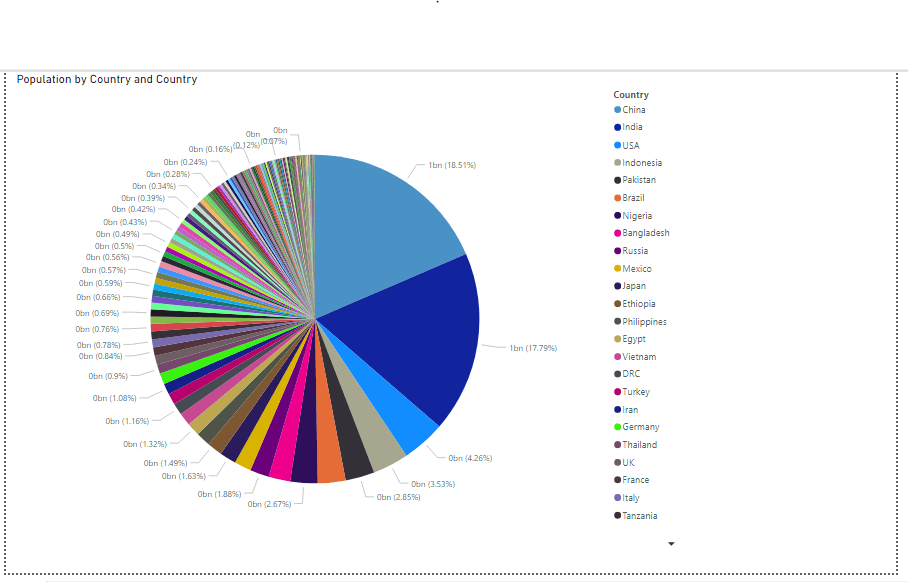
The same goes for visuals that lack context. As mentioned earlier, adding something without explanation can create the wrong impression.
Follow these best practices for impactful visuals:
-
Make sure charts are relevant to your data
-
Use charts to show the relationship between values (e.g., rate of change)
-
Use tables for comparison or communicating numbers but not trends
-
Use color to show different data sets
-
Include a graph legend or color key to add context where there is more than one category
-
Add written context to explain changes in trends
6. Get audience feedback
A few days after sending or presenting a marketing report, check in with relevant stakeholders to get their take. Ask them questions like:
-
Did you find this marketing report helpful?
-
How did it help you?
-
Was it easy to understand?
-
Is there other data you’d like to see?
-
Are you happy with the current frequency?
-
How could we improve future reports?
Getting feedback from the people using your reports is the best way to keep delivering data that makes a difference.
5 marketing reporting tools and templates
If you create marketing reports weekly or monthly, the last thing you want is to start from scratch every time. Thankfully, there’s marketing reporting software to automate reports and templates to create a repeatable framework.
Here are five marketing report templates and tools to speed up the reporting process.
1. For email marketing reports: Pipedrive Campaigns
Pipedrive is designed to streamline sales and marketing tasks, giving you more time to engage with customers.
Campaigns is Pipedrive’s built-in email marketing software. Use Insights for Campaigns to track real-time email performance and conversions and automate reports for both.
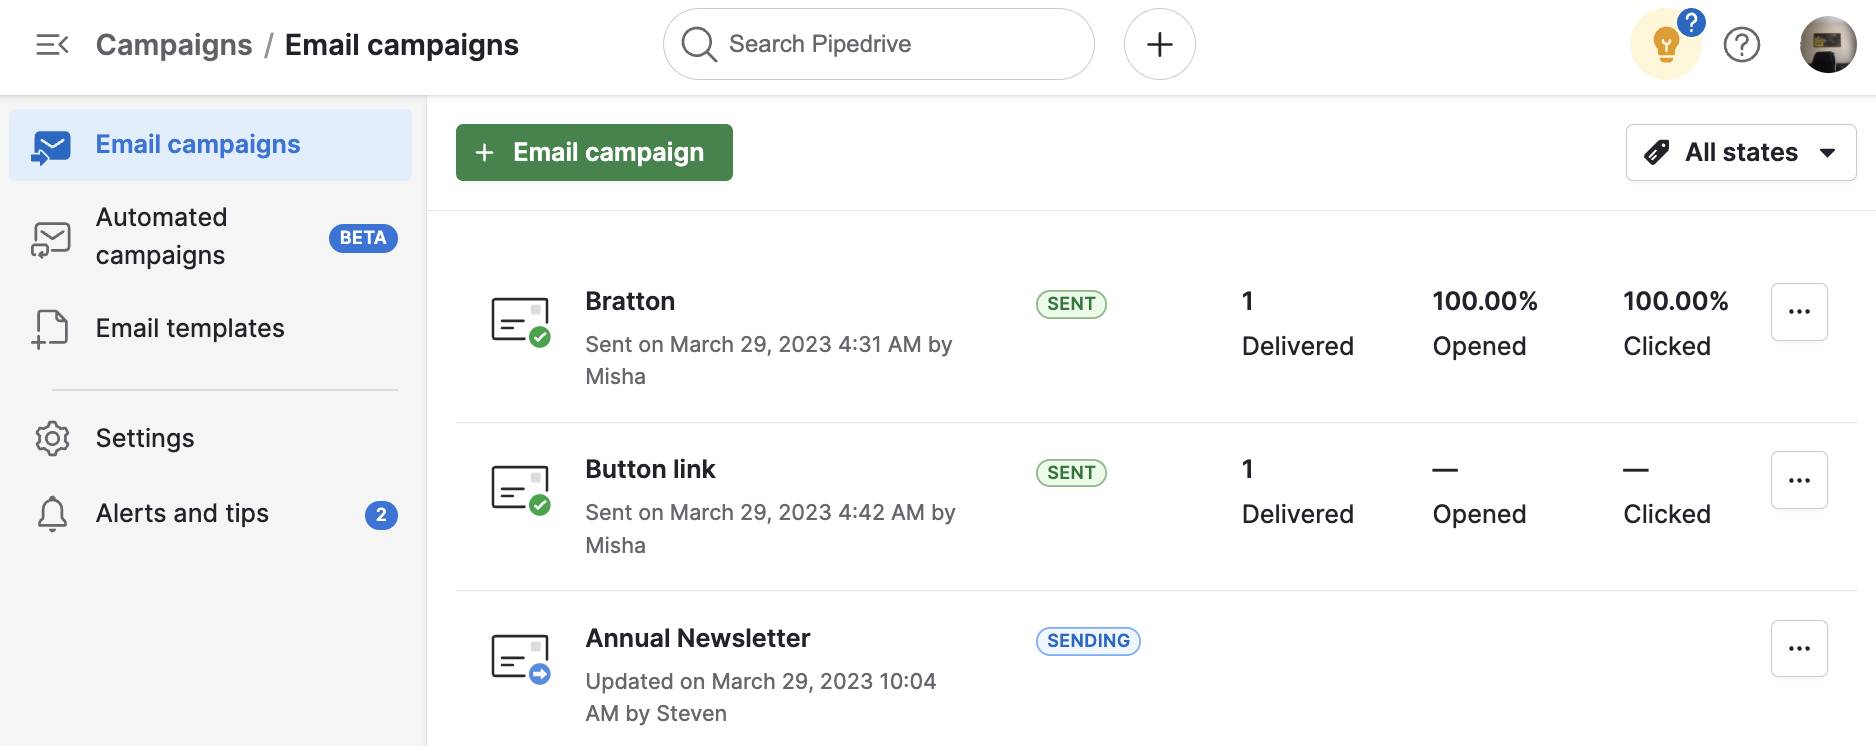
You can also choose filters and chart types to visualize specific data so your audience always sees what’s relevant to them.
Pricing: Pipedrive has pricing plans to suit different needs. Get started with a 14-day free trial.
2. For SEO and PPC marketing reports: Semrush
Semrush is a popular marketing tool suite for digital marketing reporting that helps you track performance and improve online visibility.
A Semrush account gives you access to tons of ready-to-use digital marketing report templates for gathering insightful data on search and advertising performance.
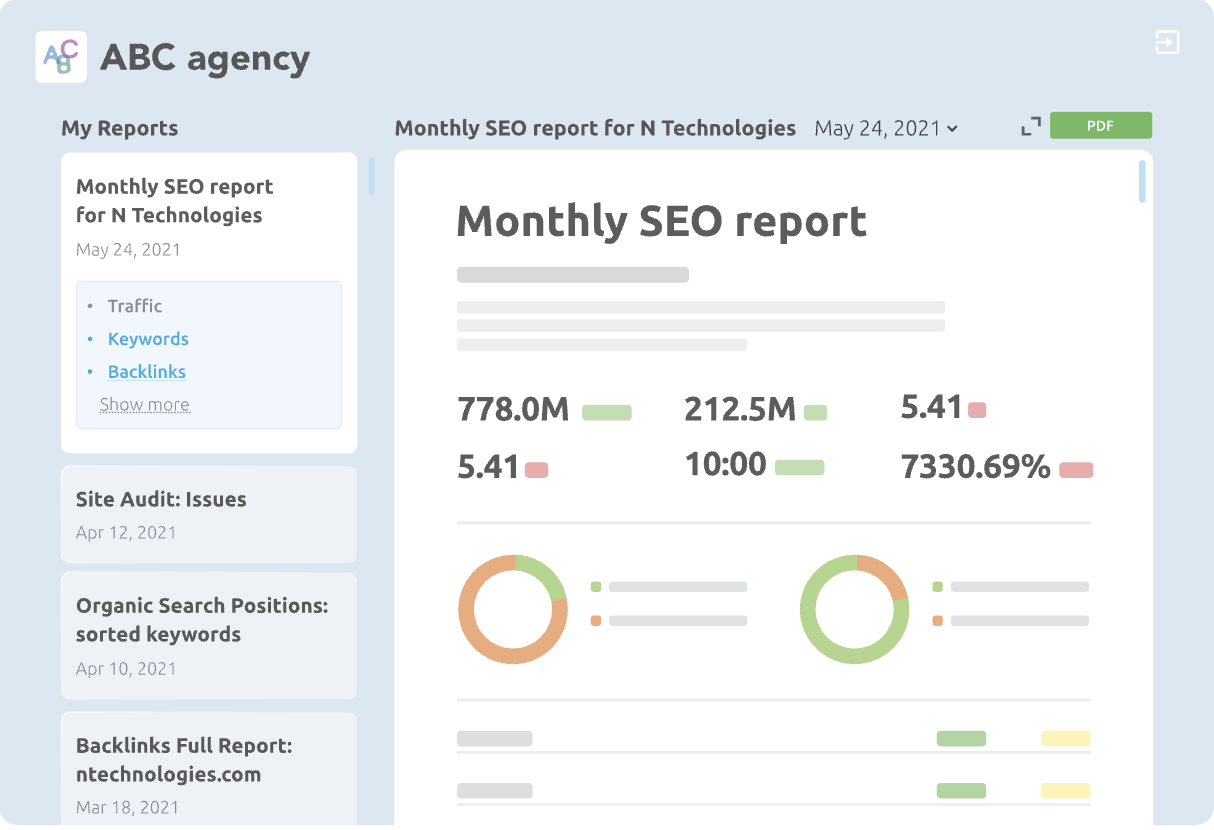
You can also run social media reports and competitor analysis. Each report is customizable and can be automated to pull the specific data for weekly or monthly reports.
Pricing: Paid plans start at $139.95 per month. A free account for individuals gives you access to My Reports with limited access to advanced features.
3. For Google Analytics reports: Looker Studio
Looker Studio (formerly Google Data Studio) is Google’s free tool for visualizing Google Analytics data. It includes a choice of ready-made reports with data on website sessions, location, audience, devices and more.
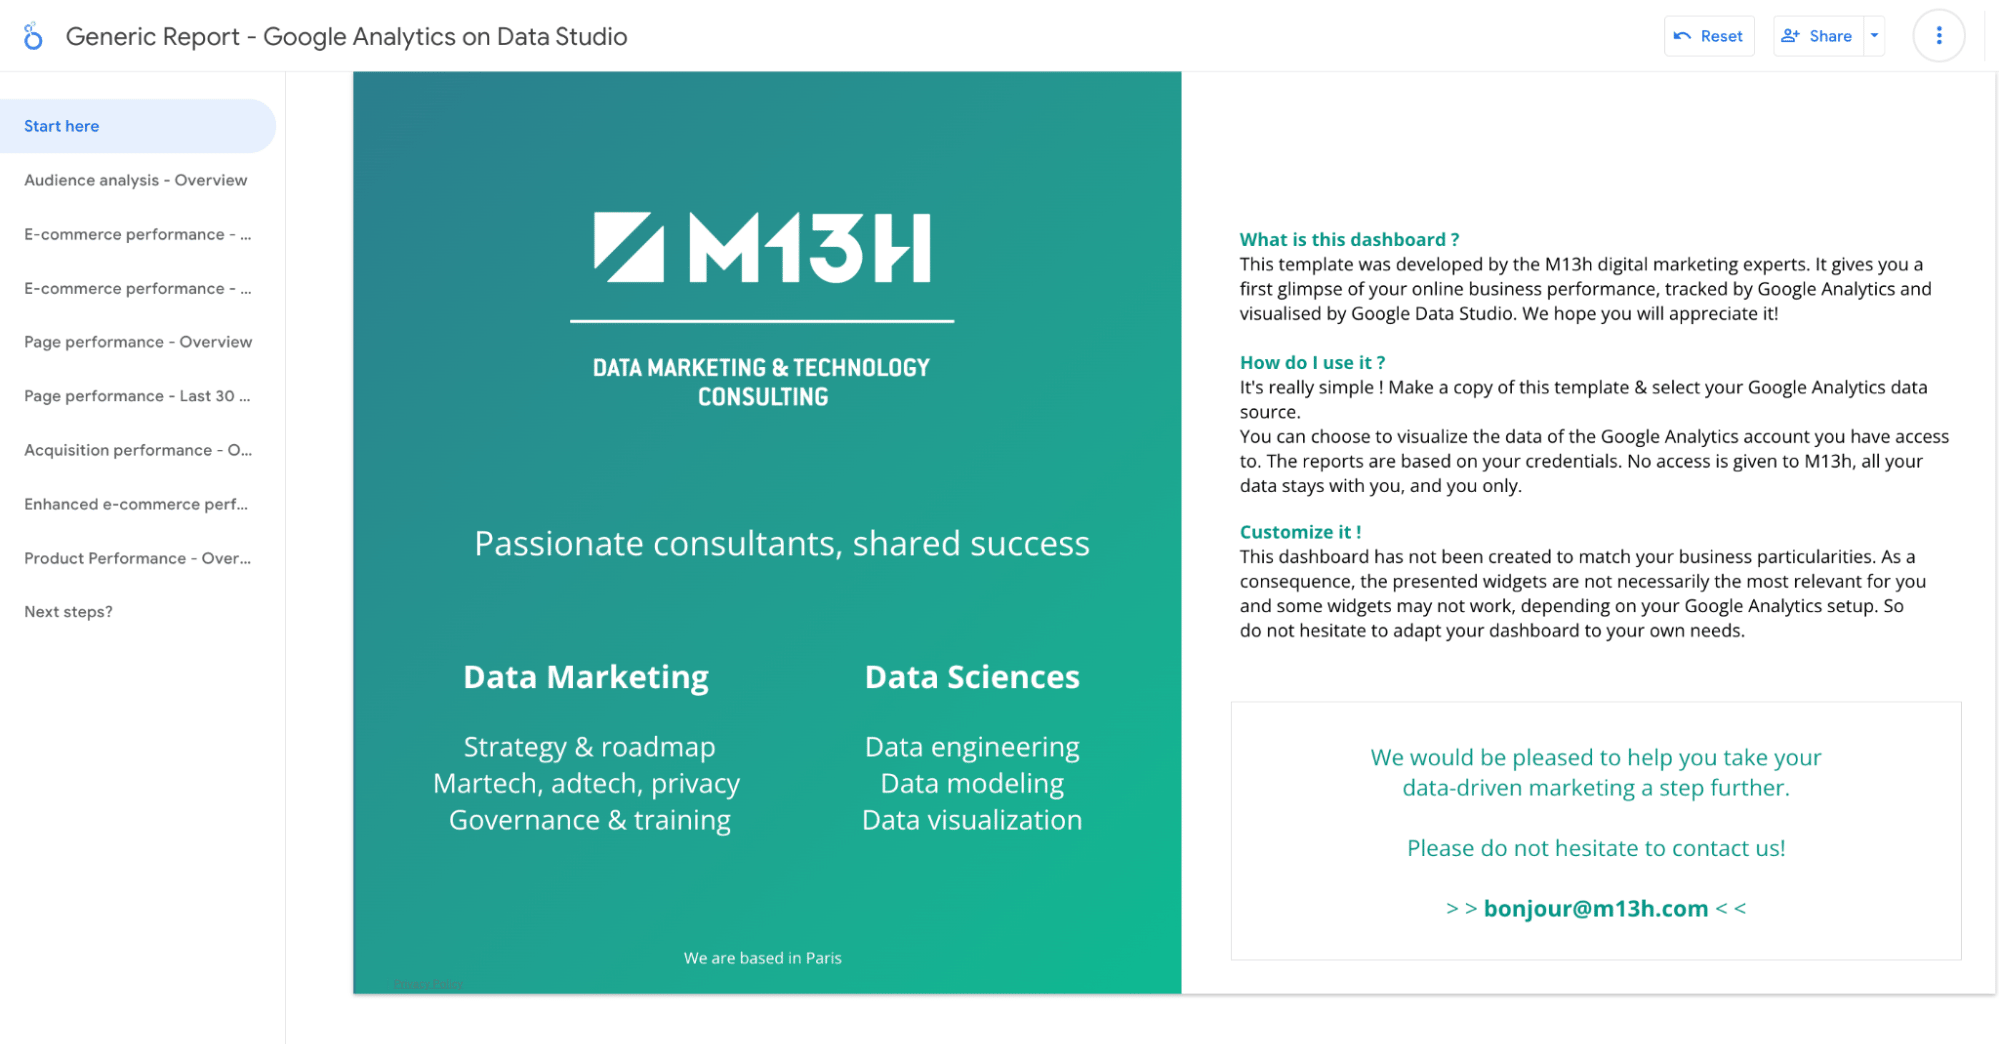
You can customize each report to suit your goals and share access with your team or outside stakeholders.
It’s a comprehensive tool, which can be both positive and negative. Its vast features let you create powerful, in-depth reports.
However, there’s a steep learning curve. Google’s Looker Studio Help resource has beginner-friendly guides to get you started.
Pricing: Free with a Google account.
4. For general marketing reports: Databox
Databox pulls data from different platforms (e.g. CRM and Excel spreadsheet) and gathers important metrics in a single marketing dashboard.
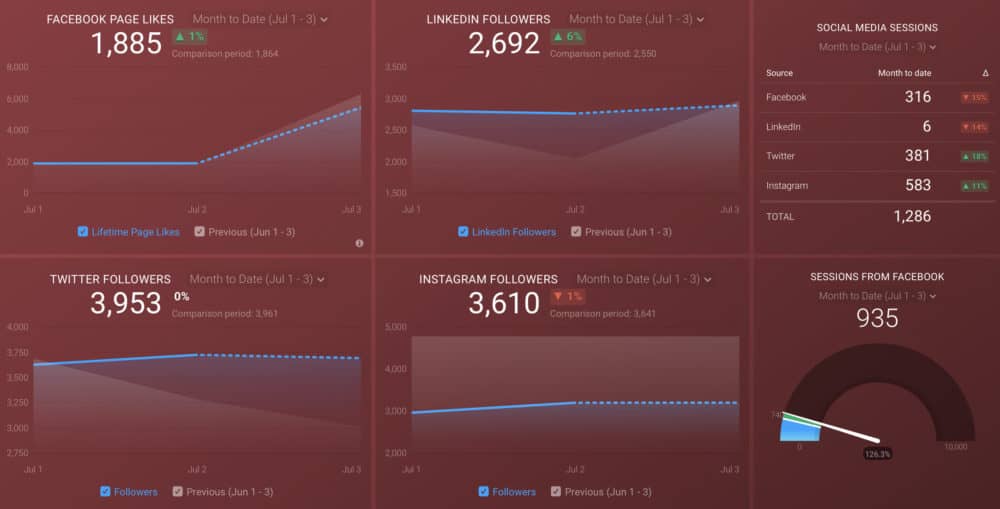
Its report editor lets you build visual reports in minutes. Input metrics, time periods and percentages to add context and change text.
You can customize final reports with your branding and automatically share them via Slack or email every day, week, month or quarter.
Pricing: Paid plans start at $47 per month. A free account lets you create reports for up to three data sources.
5. For PDF and printable marketing report templates: Canva
Canva is a beginner-friendly design tool with hundreds of marketing report templates for different uses.
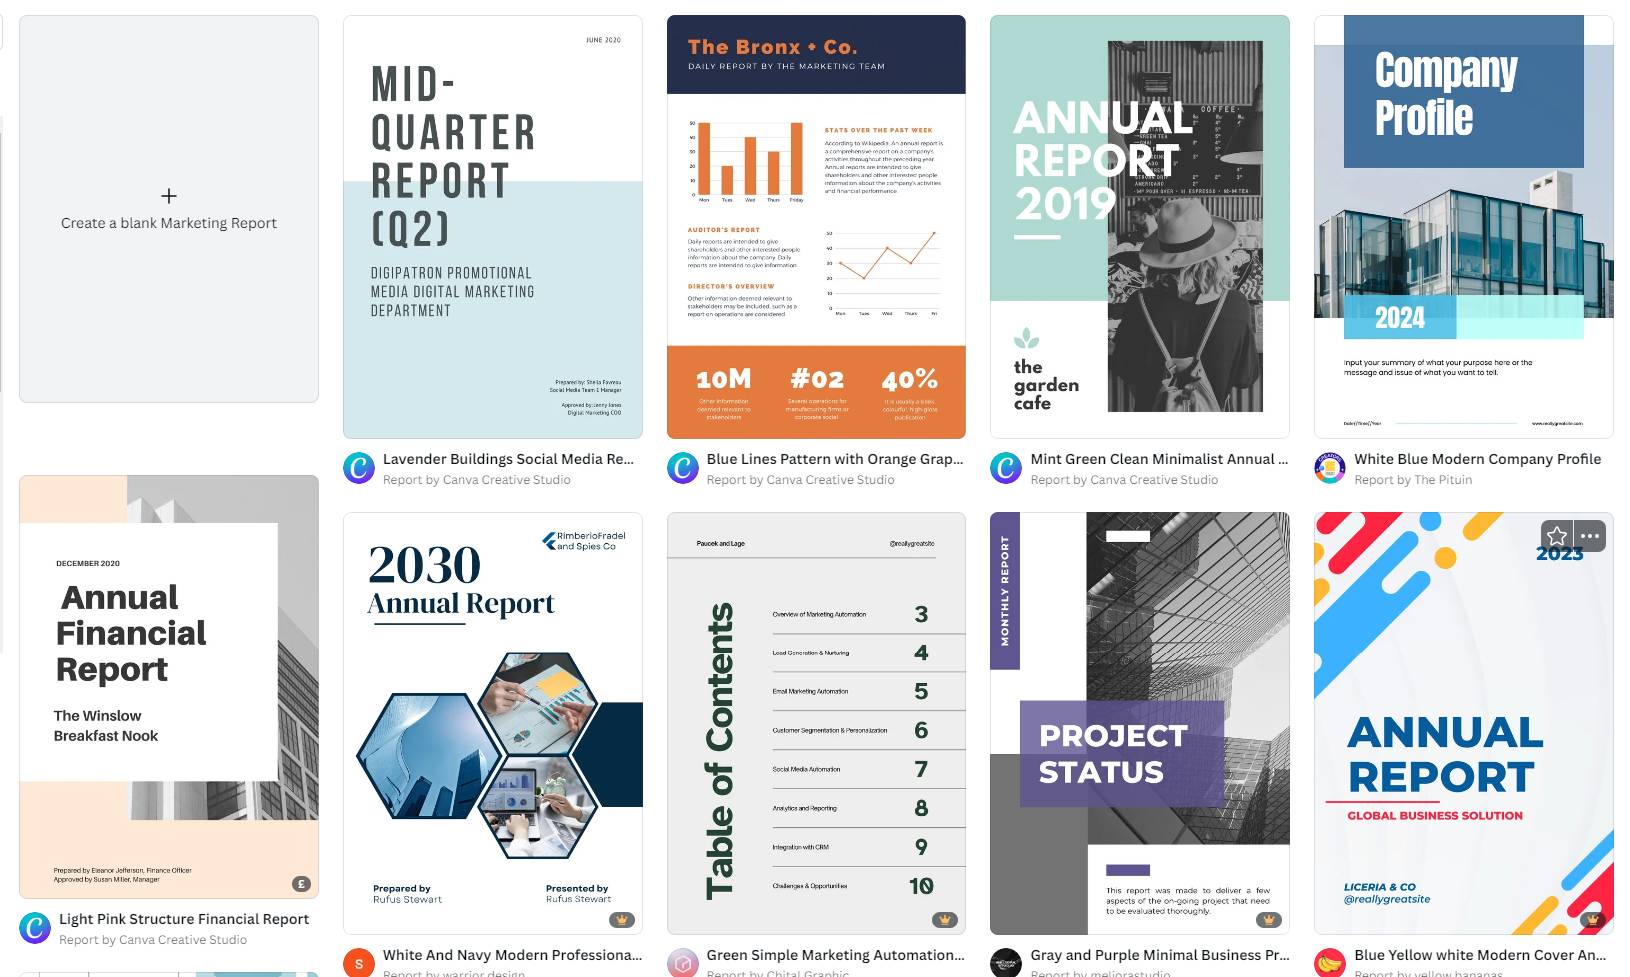
What Canva lacks in the dynamic features of other tools, it makes up for in ease of use. To create a quick report, drop your graphs and charts into a template and replace Canva’s placeholder text with your own. You can edit every template element using a drag-and-drop editor for something more personalized.
If you’re presenting in person and want to give your audience a physical report, Canva’s templates are professional enough to make a good impression.
Pricing: Paid plans start at $12.99 per month. A free account has limited features but includes enough templates and design elements to create engaging marketing reports.
Final thoughts
Marketing reporting is the difference between growing a business and standing still. Use reports to understand what works and what doesn’t in your marketing so you can continually improve.
When creating a report, focus on the end-user and the decisions they need to make. Keep data related to goals, and use simple visuals and clear context to explain complex numbers.
If information is easy to understand, you’re more likely to achieve the right outcome.
Check out Campaigns by Pipedrive to track email marketing performance and engage stakeholders with detailed visual reports.
