• Skip to primary navigation
  • Skip to main content
software stack logo

Software Stack

Get your Software Stack together

  • Knowledgebase
    • All Categories
    • Accounting Software
    • Automation & Workflow Software
    • Customer Relationship Management
    • E-Commerce Shopfronts & Payments
    • Marketing Automation
    • Online Courses & Membership
    • Project Management
    • Surveys & Forms
    • Web Hosting
  • Home
  • About Us
  • Contact Us
  • Show Search
Hide Search

CRM

Sell smarter with Capsule and LinkedIn (via Magical)

Software Stack Editor · September 16, 2025 ·

image

If you’re in B2B sales, chances are you’re already using LinkedIn as a sales tool. It’s a pretty unique social platform, with plenty of thought-leadership, hot takes, and humblebrag posts (usually accompanied by a totally unrelated selfie). However, it’s also the perfect place to connect with CEOs, executives, and other decision-makers. For many high-performing sales teams, it’s the first stop when building a prospect list.

Still, there’s a big gap between browsing profiles and actually turning them into happy customers. Copying details from LinkedIn into your CRM takes time, and when you multiply that across dozens of prospects per week, the admin quickly adds up.

To get around this, you need a reliable way to connect your CRM with LinkedIn.

Capsule provides the foundation for managing your opportunities and customer relationships, but when you integrate it with the Magical browser extension, the whole process becomes effortless and, well, magical.

With one click, a LinkedIn profile becomes a contact in Capsule, ready to be contacted, qualified, and nurtured.

In this post, you’ll get to see the full sales process, from finding new prospects on LinkedIn to closing opportunities in Capsule. Along the way, you’ll see how Magical’s integration cuts down on manual work, so you can spend more time selling.

1. Prospecting efficiently with Magical and Capsule

Prospecting often starts with a single profile. You spot someone on LinkedIn who fits your ideal customer profile (ICP). So, how do you get all their relevant details into your CRM without wasting ten minutes copy-pasting?

Magical is an extension for Chrome and Edge that sits right on top of LinkedIn. When you land on a prospect’s profile, you can trigger Magical to pull key information automatically, including:

  • Full name
  • Job title
  • Company
  • LinkedIn profile link.

In just one click, you have a clean, structured contact with all the key details created in Capsule. If there’s more data available, like an email address, Magical can often enrich the record using third-party data sources.

Here’s how it works in practice:

  1. You find Daniel, a Head of Marketing at an awesome SaaS company.
  2. Instead of jotting down his details or copying them into Capsule manually, you hit the Magical button and select the “LinkedIn Profile to Capsule” automation.
  3. Daniel’s details instantly appear in Capsule as a new contact, complete with a link back to his LinkedIn profile.

The difference seems small at first, saving a few minutes here and there. But when prospecting is a daily activity, those minutes add up quickly. More importantly, you reduce the risk of errors or missing information, which makes your database far more reliable in the long run.

2. Scaling outreach with Sales Navigator and Google Sheets

Finding one good prospect is helpful. Finding fifty in the same niche is where LinkedIn really shines, especially if you’re using Sales Navigator. The challenge, of course, is moving that list into your CRM without drowning in manual admin.

Magical makes this much easier by working with Sales Navigator searches. Instead of copying names one by one, you can transfer a page of results directly into a Google Sheet. From there, it’s a simple export and import into Capsule.

Let’s run through that now:

  1. You run a Sales Navigator search for “UK-based SaaS CMOs” and get several pages of results.
  2. With Magical, you use the “Add to a new spreadsheet” automation and move details from the first page straight into a Google Sheet, with every profile neatly listed, including name, company, title, and LinkedIn URL.
  3. You then export the sheet as a CSV and import it into Capsule.

Within minutes, you’ve got 50 new leads in your Capsule account.

This bulk workflow is a huge time saver. What used to take an hour of copying and pasting now takes a couple of clicks. Even better, you can import the data into Capsule with Tags or Custom Fields that show exactly where it came from, making reporting and segmentation easy later on.

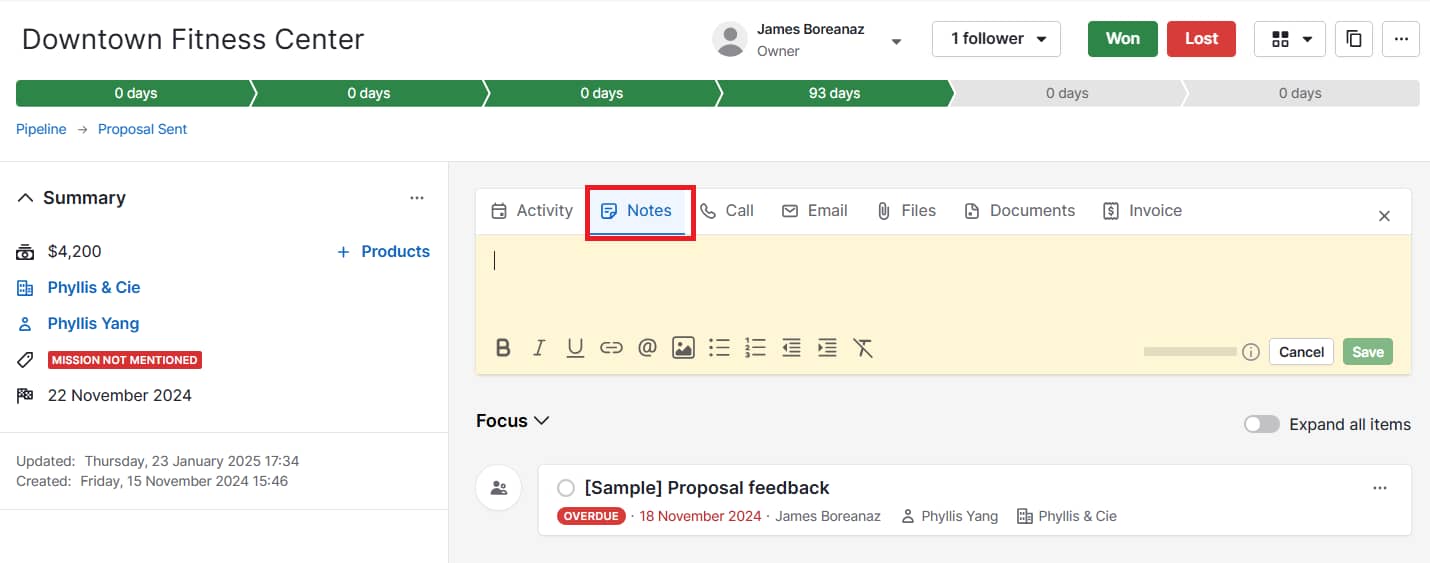
3. Organizing leads inside Capsule

Once you’ve got your leads into Capsule, you need to start organizing them in a way that makes future outreach simple. With Capsule’s tools, LinkedIn-sourced leads become a set of opportunities you can act on.

Let’s see how we can use those leads we found in the first steps and get them ready for qualification:

  1. After adding Daniel, the SaaS Marketing Director, to Capsule with Magical, you tag his record with “LinkedIn lead”.
  2. You also create a Custom Field called “Industry focus” and fill this in for Daniel as “SaaS marketing”.
  3. Capsule’s built-in Enrichment fills in additional company details based on the company domain like website, size, and industry.

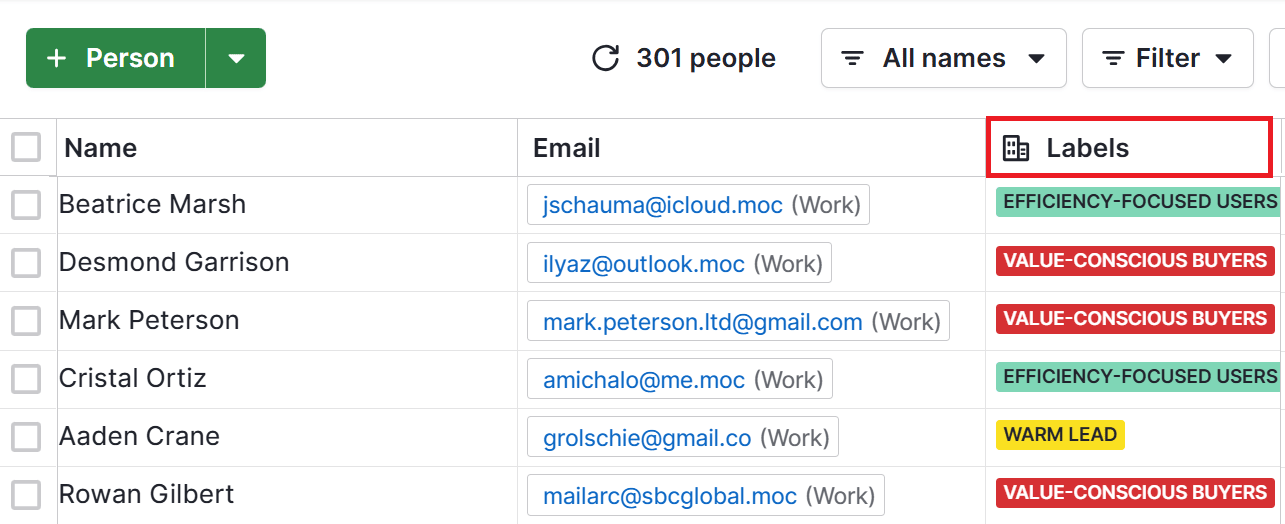
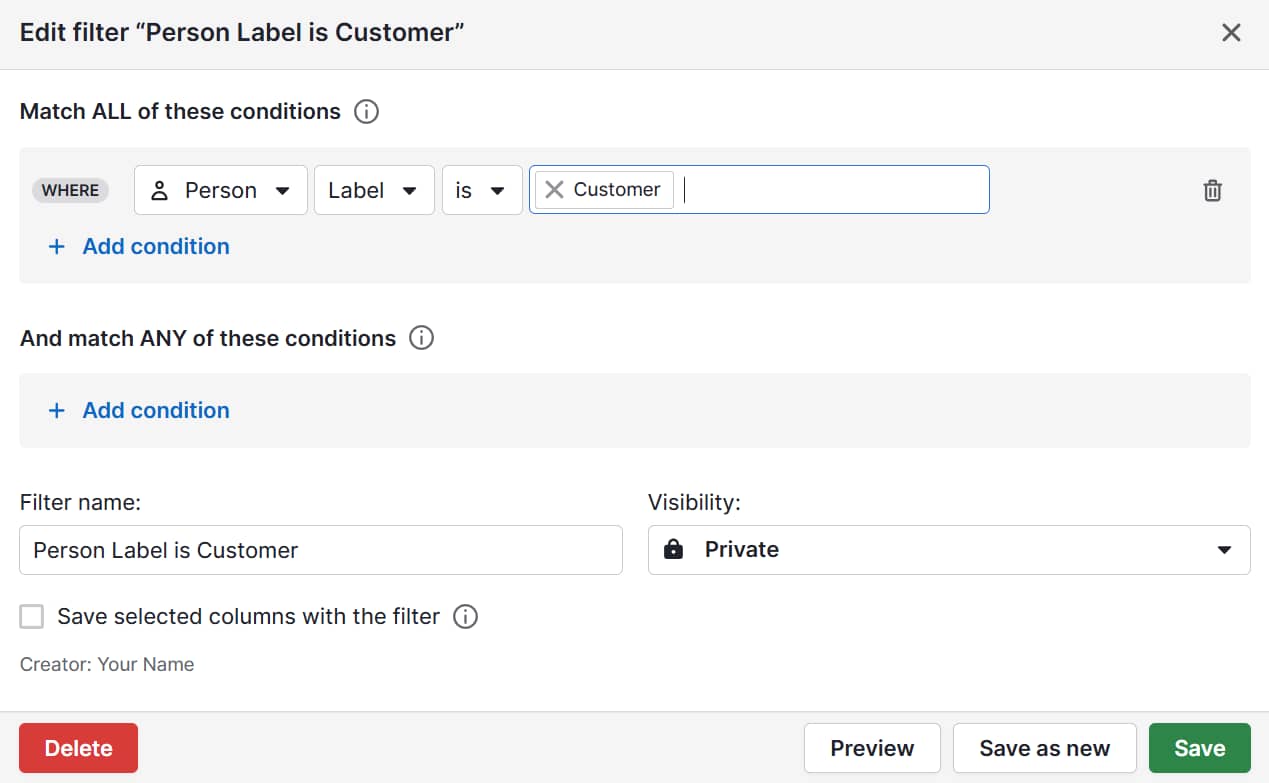
Now, when you filter your database, you can quickly build lists like “SaaS CMOs in the UK” or “LinkedIn-sourced marketing leaders”.

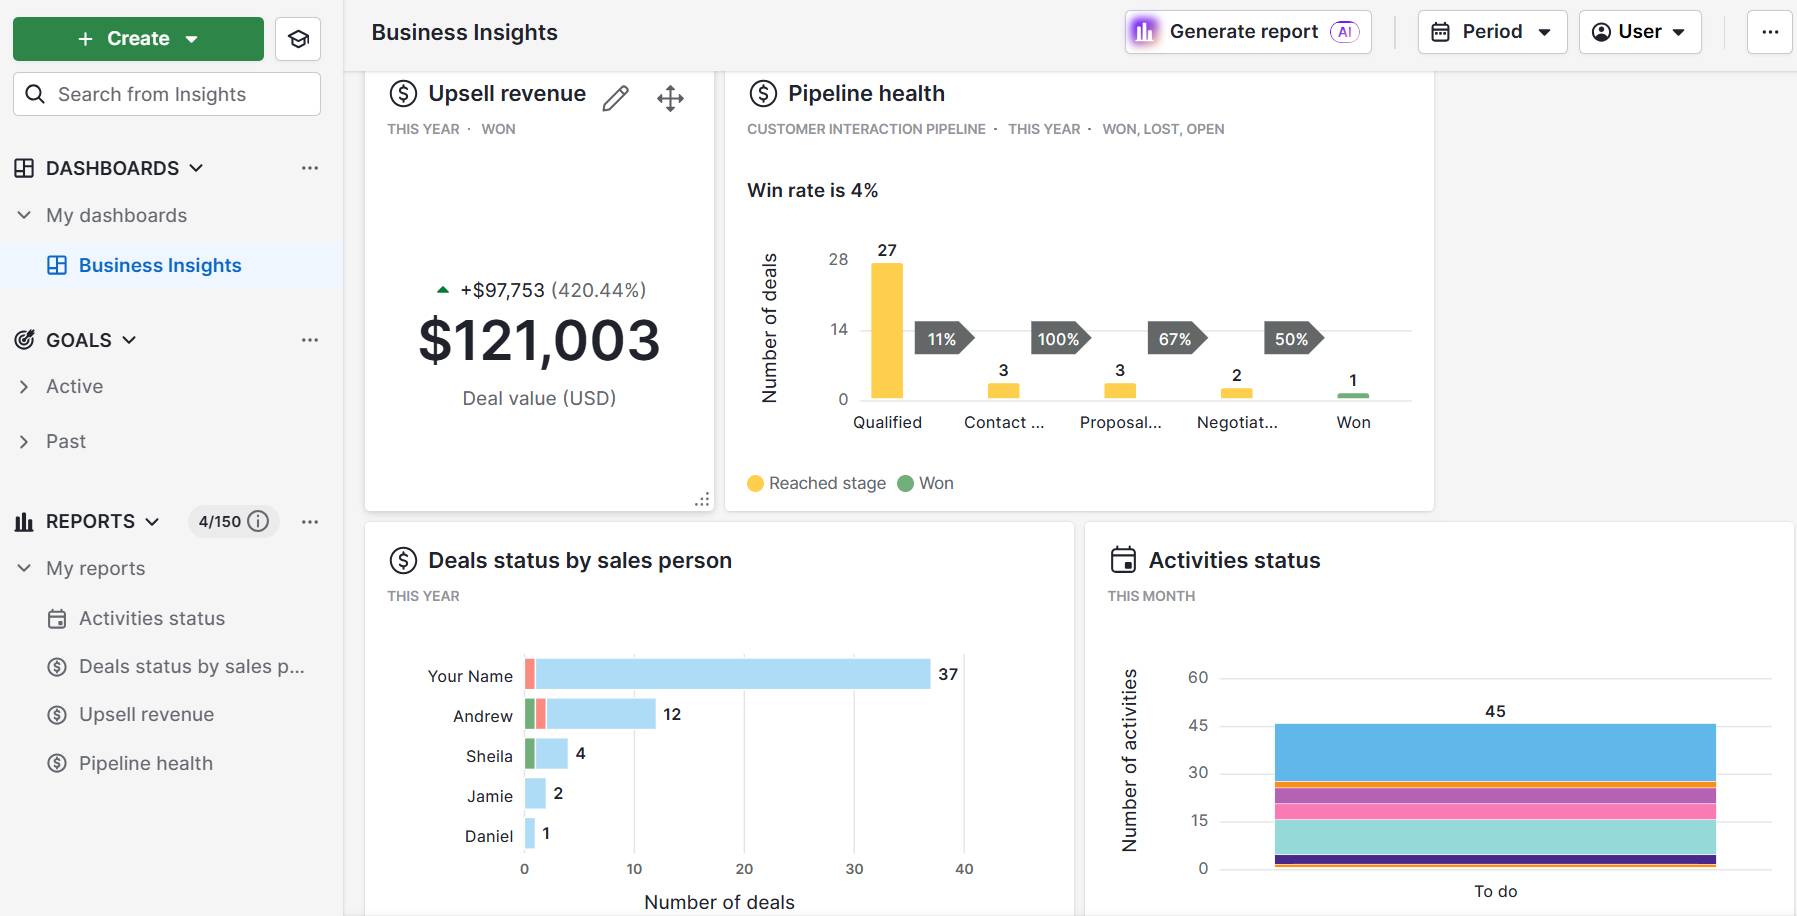
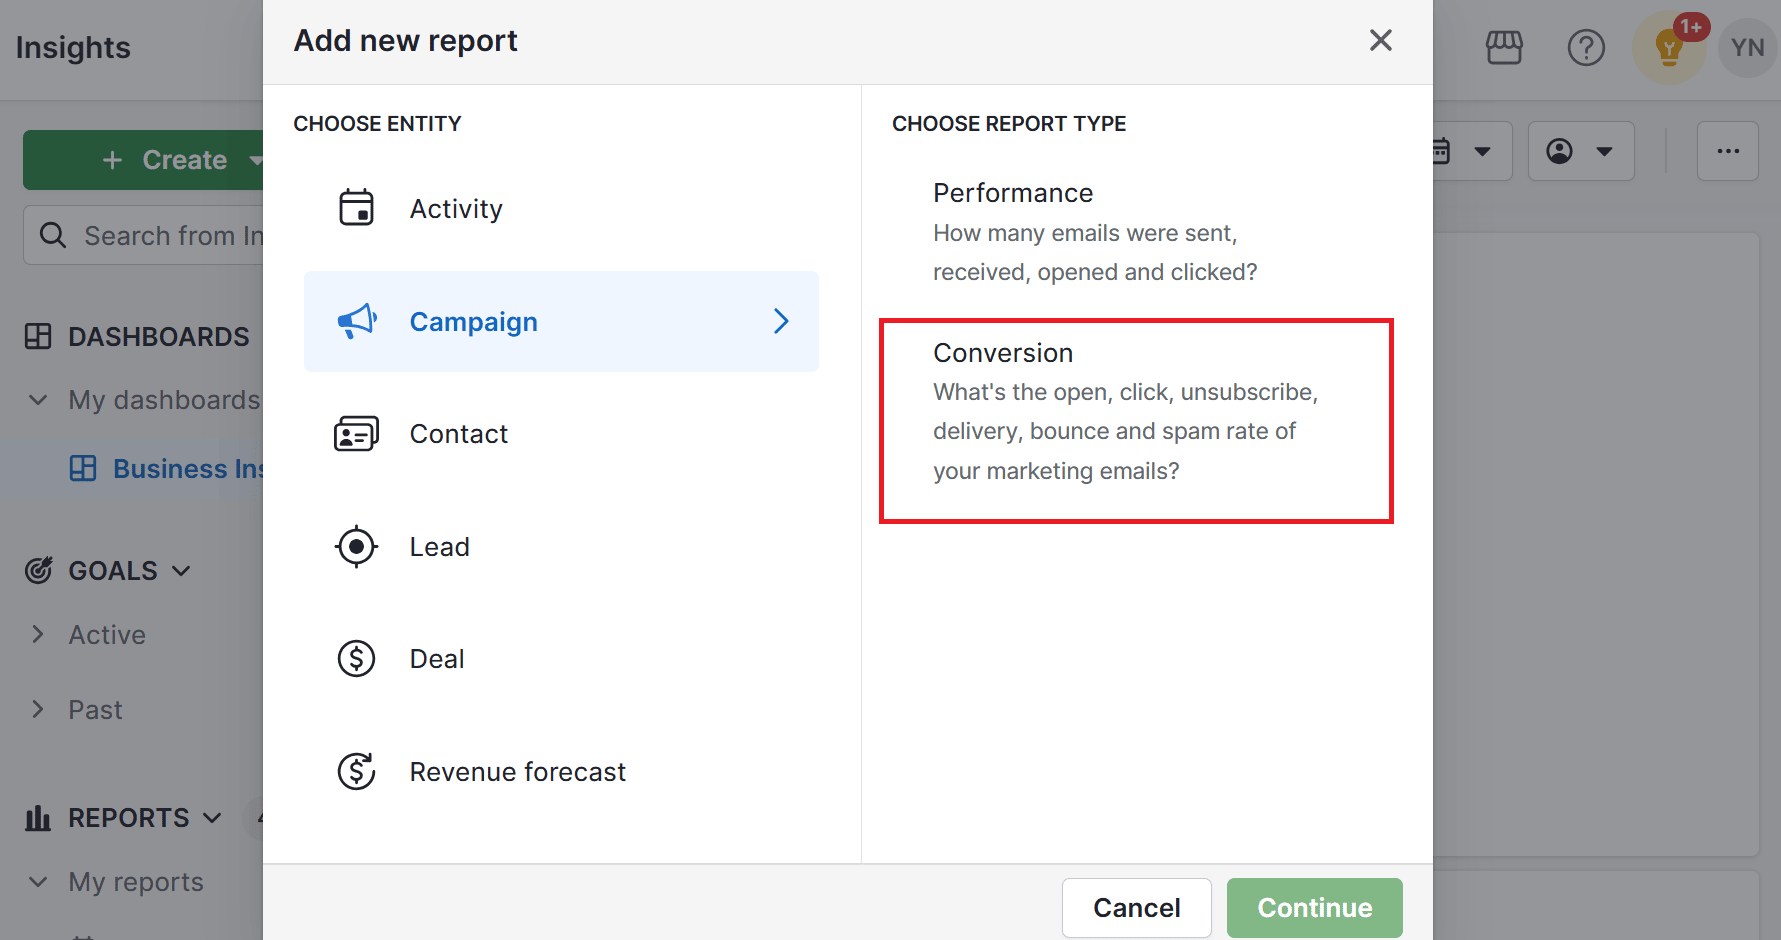
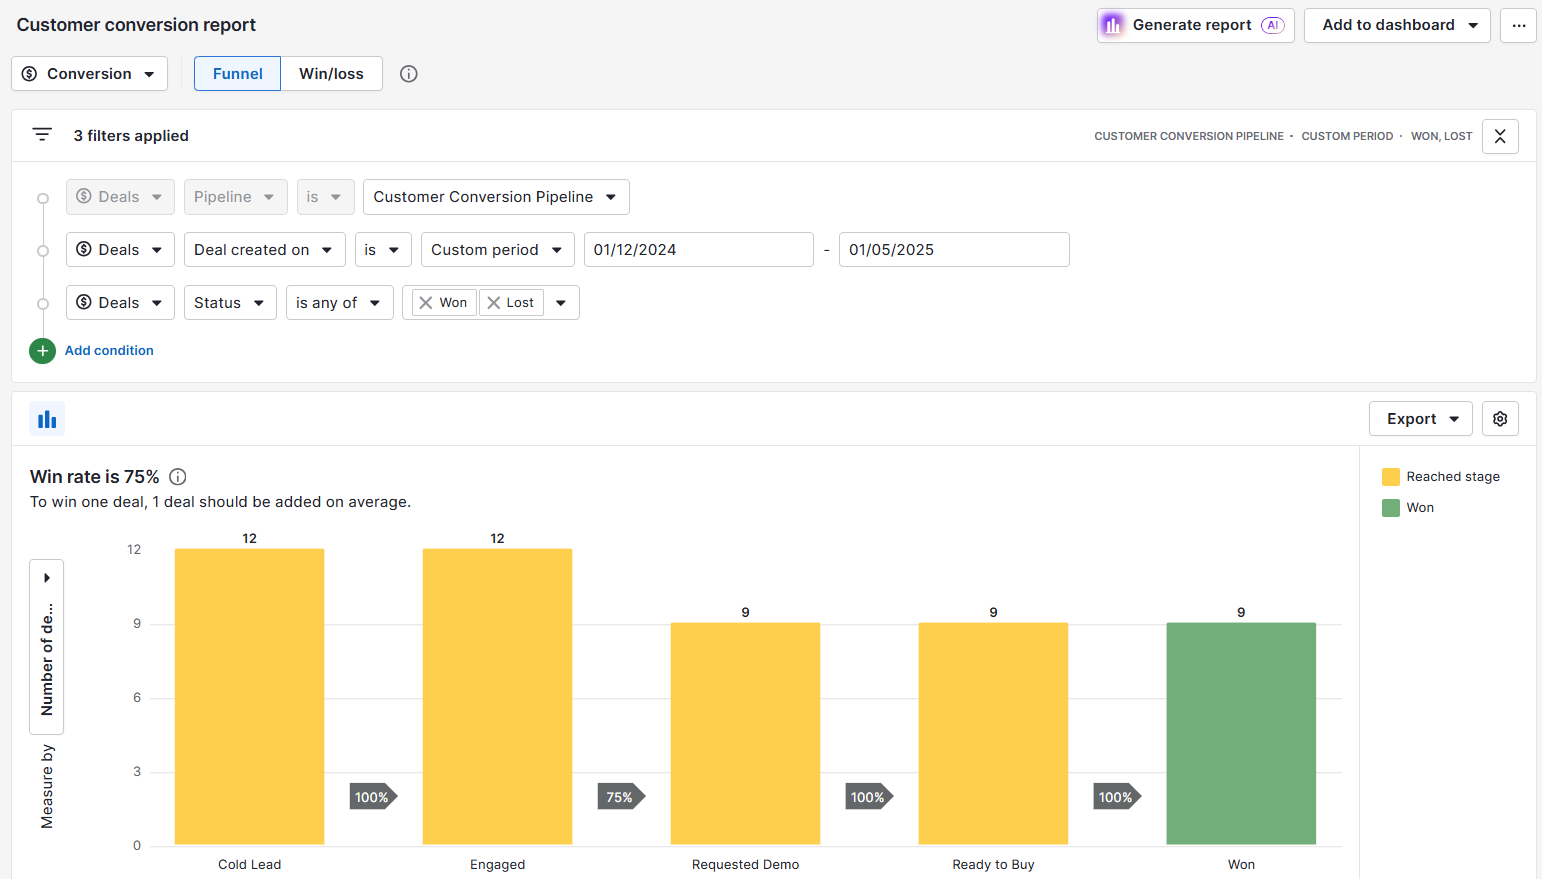
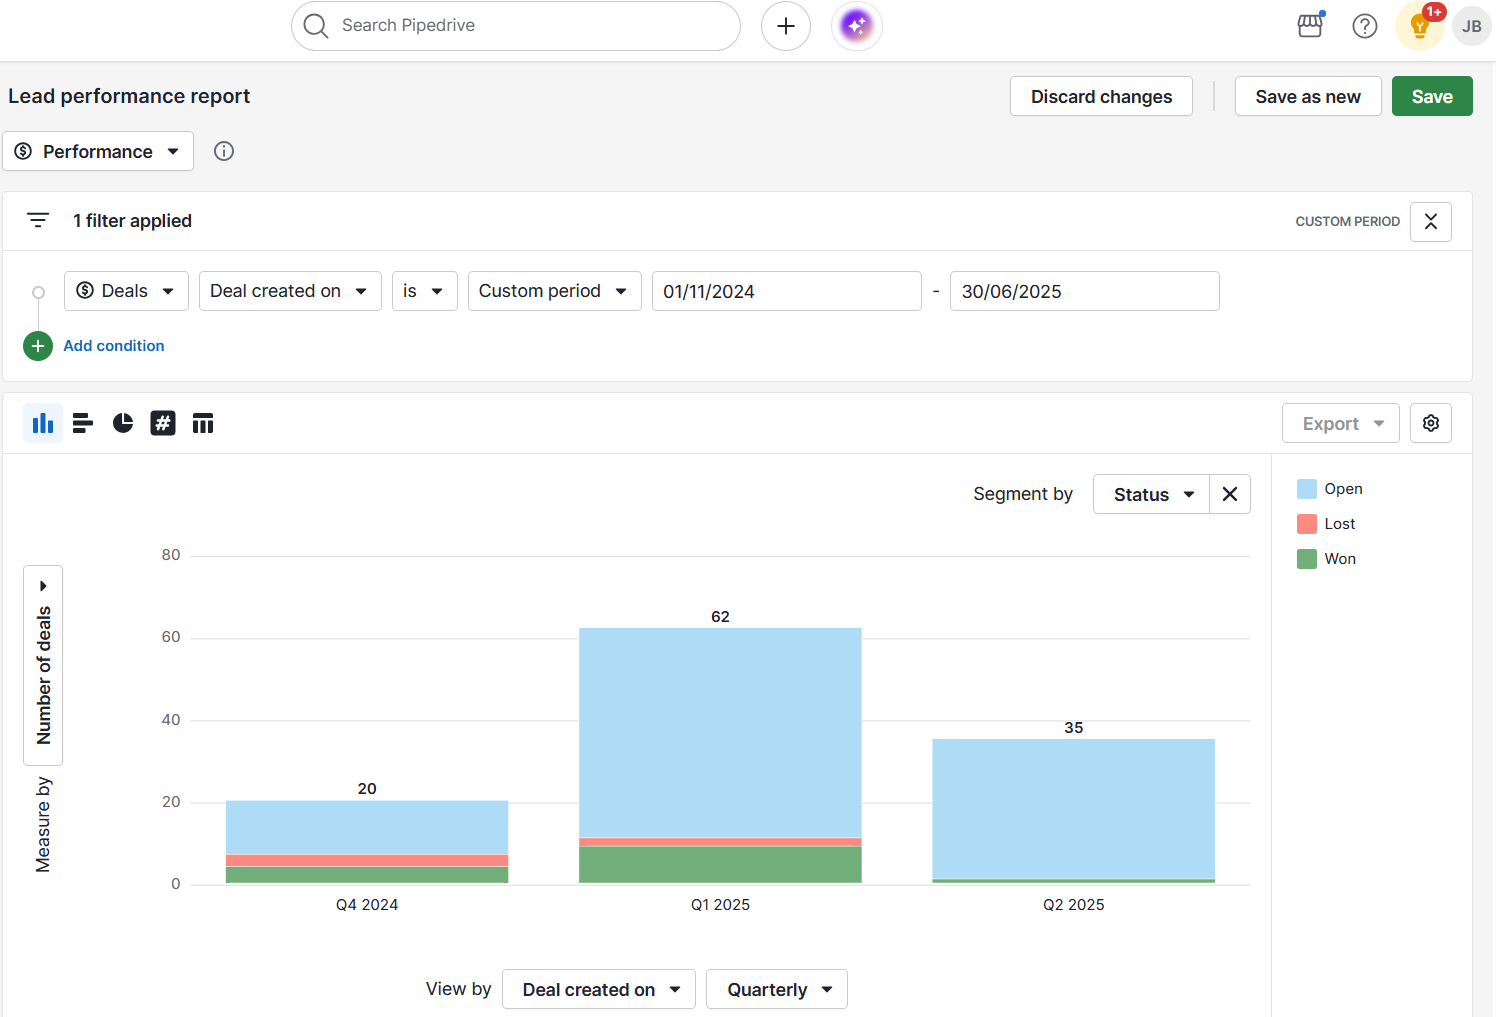
Instead of sending the same message to everyone, you can tailor your approach. For example, SaaS CMOs might get a case study on improving MRR, while agency owners get a guide on winning more clients. By tagging LinkedIn leads, you can also then run reports to see exactly how much pipeline and revenue you’ve generated prospecting on LinkedIn.

By combining Magical’s autofill features with Capsule’s segmentation, you get a database that you can actually use to make more sales. You know where each lead came from and how they fit into your overall sales strategy.

4. Streamlining outreach with templates and text expansion

Now that your leads are nicely organized, you can start reaching out to them. However, sending connection requests, first messages, and follow-ups can eat up a huge chunk of your day if you’re retyping them every time.

Magical can save time here, too. Along with saving information from LinkedIn profiles, it also acts as a text expander and template tool. That means you can create short snippets for common messages and expand them instantly while you’re typing on LinkedIn or in Capsule.

Let’s see how we can use this with our new prospects:

  1. You send Daniel a connection request. Instead of typing from scratch, you use a Magical trigger to drop in a short, friendly intro template you’d created earlier, “Hi {First Name}, I work with SaaS companies like {Company Name}. Would love to connect and share ideas.”
  2. When Daniel accepts, you follow up with a saved Magical template that introduces your service in more detail.
  3. Later, when you email him via Capsule, you pull in one of your pre-written Capsule email templates, which automatically personalizes with his name and company.

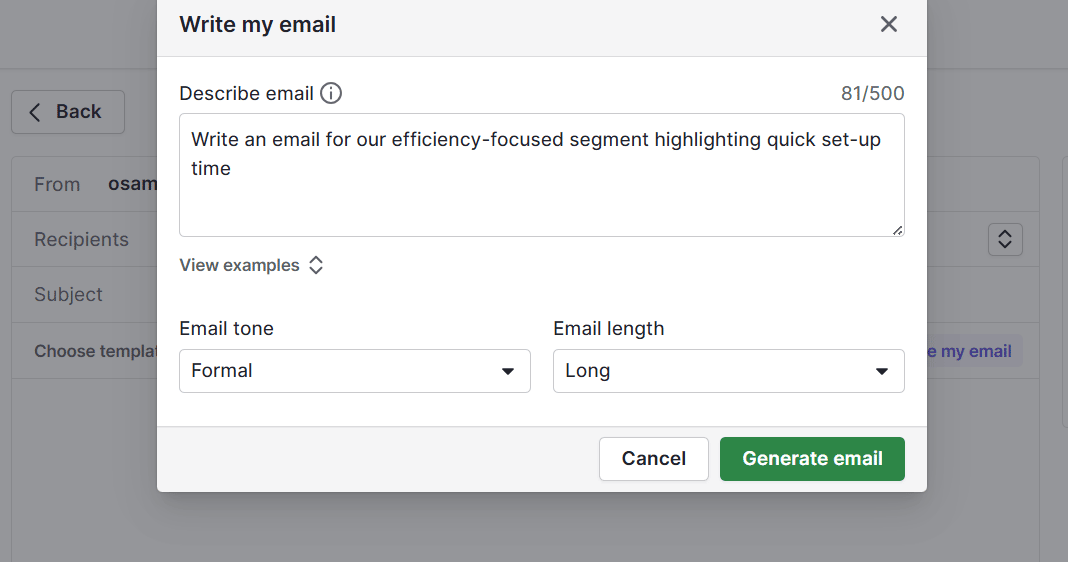
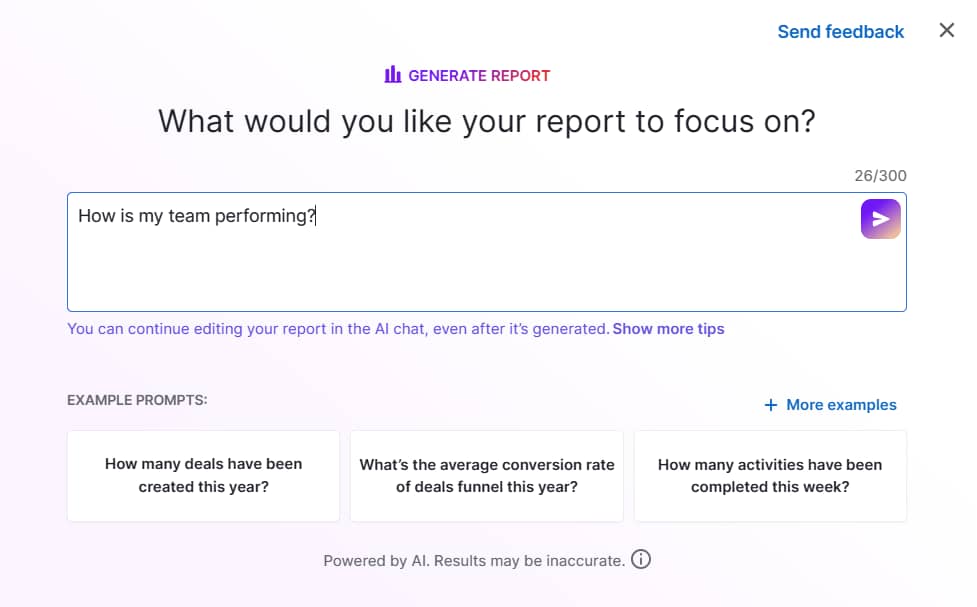
You can also use Capsule’s AI Content Assistant to quickly draft up messages in your chosen tone of voice.

What used to take minutes per message now takes seconds, freeing up time for actual conversations. Every prospect gets a professional, polished message, personalized with the information you found with Magical and Capsule’s enrichment features.

Whether you’re messaging on LinkedIn or emailing through Capsule, templates give you a consistent voice across channels.

5. Managing the sales process in Capsule

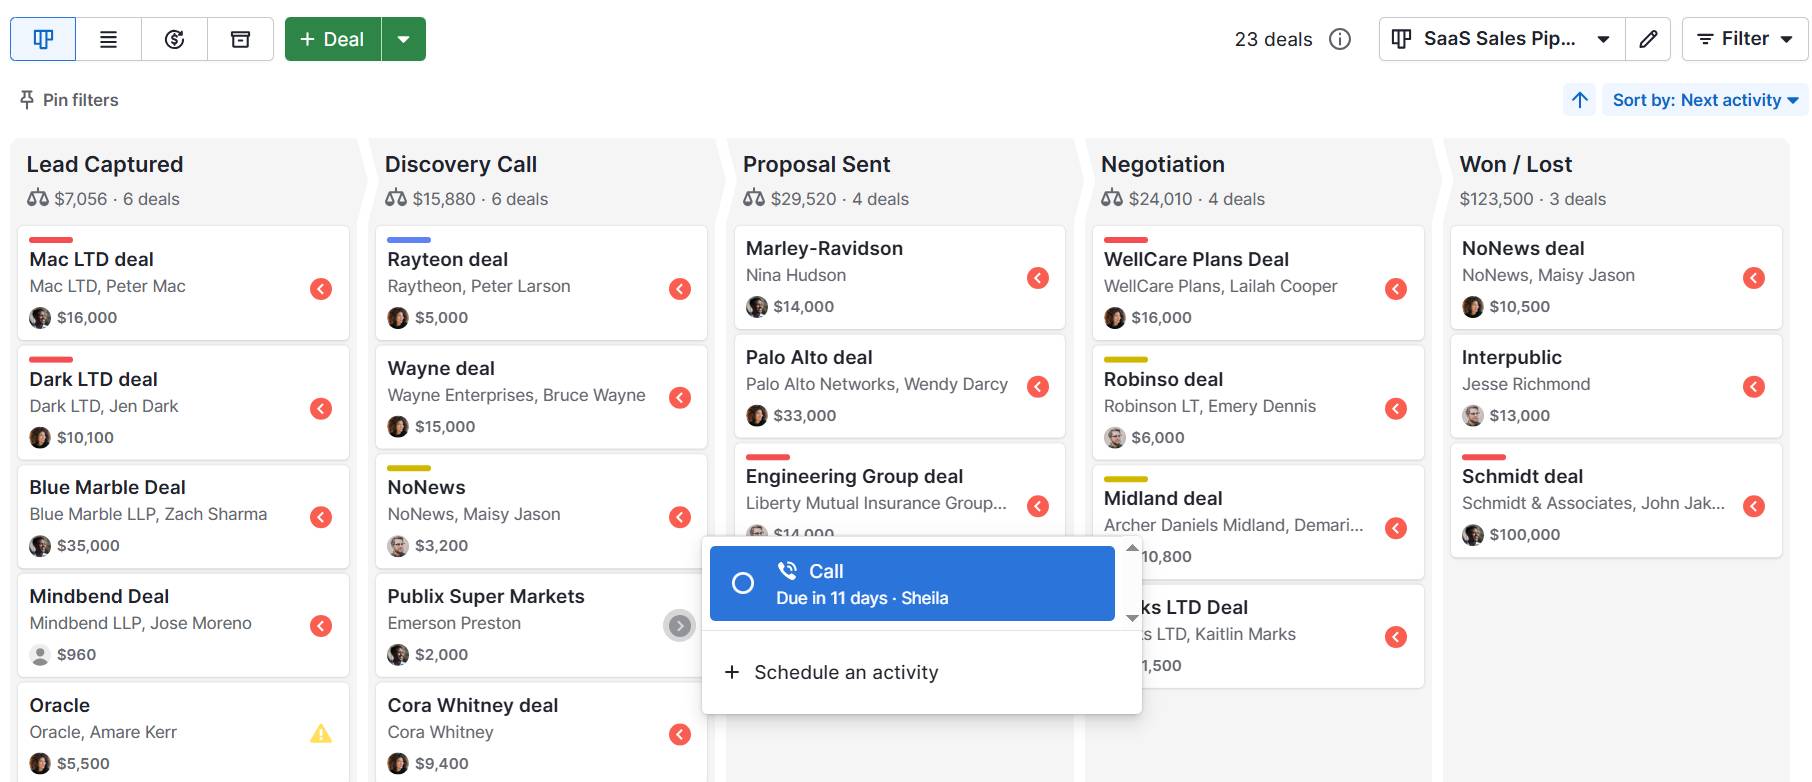
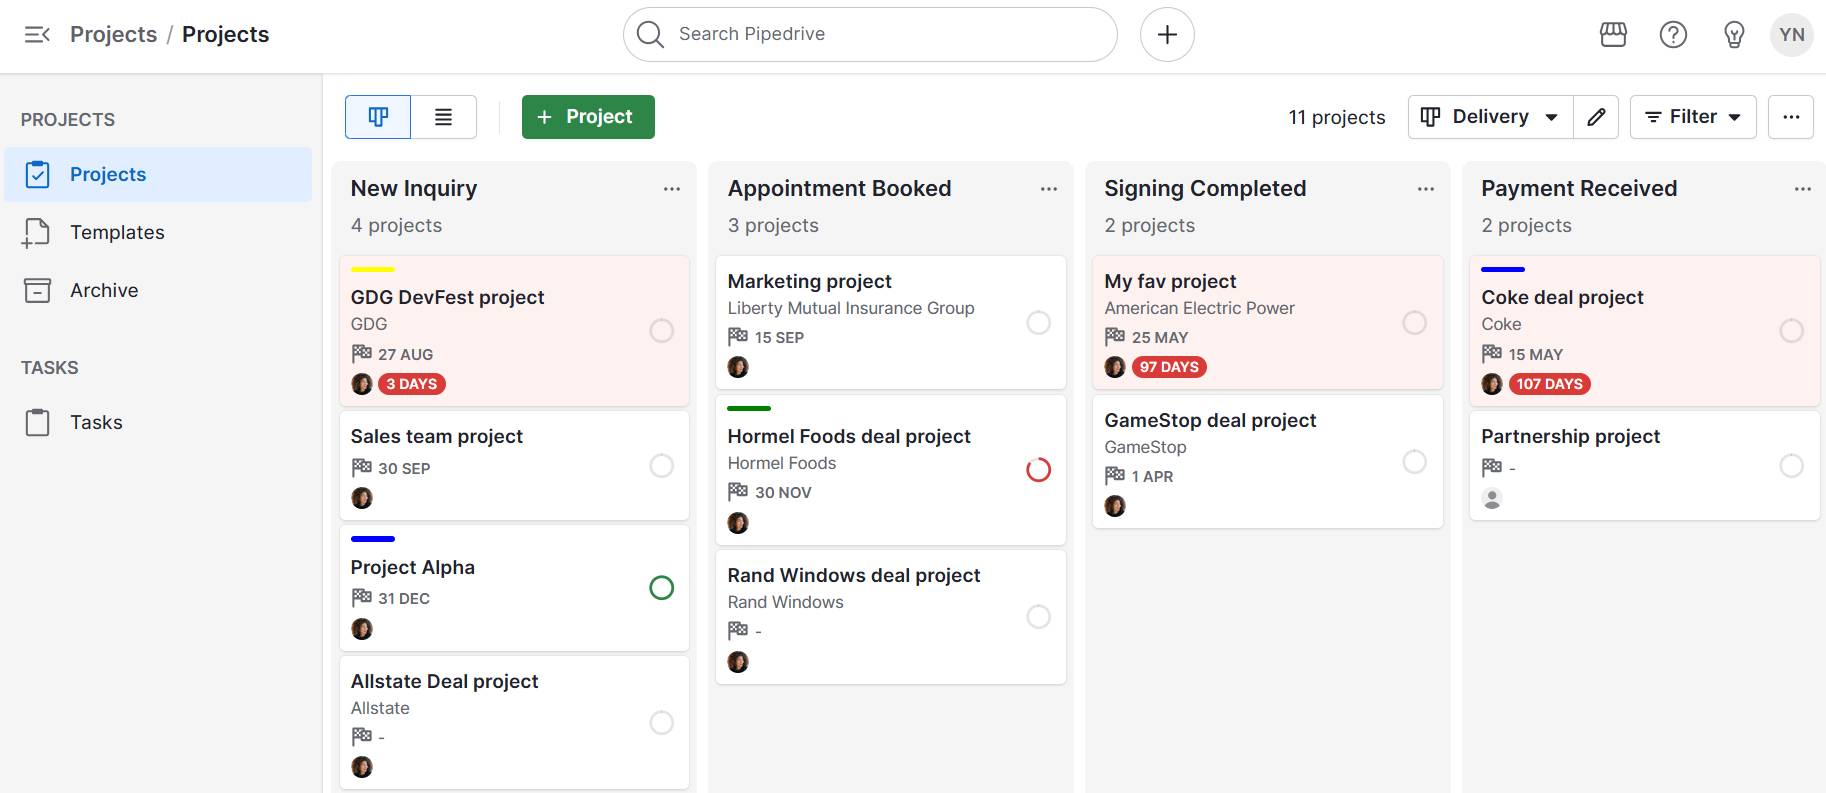
We’ve now reached out to our prospect and have started the ball rolling. To actually win the business though, you’ll need to move each LinkedIn-sourced lead through a structured sales process. Capsule makes this simple by letting you track every stage and set clear tasks along the way.

After Daniel replies positively to your LinkedIn message, you create a new opportunity in your Sales Pipeline. You can then use Capsule’s Tracks (a templated to-do list) and Workflow Automation to automate the follow-up process and keep it consistent.

For example, you could create a Track called “LinkedIn outreach,” which includes tasks like:

  • Day 1: Send LinkedIn connection request
  • Day 5: Follow up if no response
  • Day 10: Share a relevant case study
  • Day 15: Schedule a call.

Each task appears in Capsule at the right time, ensuring nothing’s forgotten about and left to ‘go cold’.

Every rep follows the same structured process, which means prospects get a uniform, professional experience. By logging LinkedIn messages and email touchpoints in Capsule, you create a single record of the entire relationship for everyone involved.

Going from profile to pipeline

LinkedIn is where business conversations start, but without the right tools, those conversations don’t always make it into your pipeline. Capsule and Magical change that by connecting the dots between prospecting, outreach, and deal management.

When you zoom out, the real power of Capsule and Magical is how seamlessly the whole process flows. Instead of juggling LinkedIn tabs, spreadsheets, and hastily-handwritten notes, you’ve got one streamlined workflow that takes you from first click to closed deal.

With Magical, you can capture LinkedIn contacts in seconds and use templates to speed up your outreach. With Capsule, you can organize those leads, track every touchpoint, and move opportunities through a structured sales process.

Together, they remove the friction from LinkedIn selling, so you can focus on building relationships and closing deals.

Ready to see how much smoother your sales process can be? Try any Capsule plan free for 14 days or sign up for our free plan to get started with a simple yet powerful CRM.

5 Key Differences Between IaaS, SaaS and PaaS

Software Stack Editor · September 16, 2025 ·

Cloud systems like IaaS, SaaS and PaaS help SMBs create custom applications, manage business operations and drive revenue growth.

The key is knowing which model fits your needs – whether that’s full infrastructure control, a flexible platform for developers or ready-to-use business tools. Using the right option helps you reduce costs and maximize resources.

This article breaks down each system to show differences, benefits and best use cases, so you can confidently choose what works for your business.

Key takeaways about IaaS, SaaS and PaaS

  • PaaS (platform as a service) delivers a full app development environment, suiting developers who want to build quickly without managing hardware.

  • Pipedrive’s SaaS CRM helps SMBs automate sales tasks, centralize customer data and access clear dashboards to drive smarter decisions – sign up for a free trial today.

What is IaaS, SaaS and PaaS? A simple breakdown

IaaS, SaaS and PaaS providers are cloud computing service models that offer different levels of control and management for business operations.

Note: Cloud computing service models are different ways of delivering IT resources online, ranging from raw infrastructure to app-building platforms to ready-to-use software.

Choosing the correct type of cloud computing ensures you have the right balance of control, cost and convenience.

For small and medium businesses (SMBs) with limited resources and budgets, selecting the best tool is crucial to avoid overspending and free up time and money without unnecessary technical overhead.

Here’s a breakdown of each type and what it offers.

Infrastructure as a service

IaaS provides the basic building blocks of cloud computing, like virtual servers, storage and networking.

Instead of buying and maintaining physical hardware, businesses rent IaaS resources from a provider and scale them up or down as needed.

This flexibility allows companies to:

  • Host websites and applications. Companies can deploy websites, e-commerce platforms or software applications with minimal setup, while the provider handles server maintenance and uptime. IT teams can then focus their efforts on development and user experience.

  • Amazon Web Services (AWS) and Microsoft Azure are popular examples of IaaS platforms, providing:

Here’s an example of the AWS interface:

IaaS SaaS PaaS Amazon Web Services (AWS) interface

These platforms offer ready-to-use cloud infrastructure with advanced security, monitoring and compliance tools – letting businesses focus on running applications rather than maintaining hardware.

Software as a service

SaaS delivers software applications over an internet connection, allowing users to access tools directly through a web browser without needing installation, maintenance or updates.

This format makes it ideal for businesses that want fast, reliable access to tools without the technical overhead.

Teams use SaaS systems to manage business processes, communicate and collaborate efficiently. The SaaS provider handles updates, security and backend maintenance.

This setup enables companies to:

  • Access tools instantly. Employees can log in from anywhere on any device without complex installation, boosting productivity.

  • Simplify IT management. The provider handles updates, security patches and infrastructure. Internal IT teams can focus on strategic planning and tasks rather than routine maintenance.

Pipedrive is a good example of a SaaS cloud platform. The sales CRM lets growing businesses manage leads, track deals and organize customer interactions entirely online.

Sales teams can access dashboards from anywhere, automate repetitive tasks like follow-ups and gain insights from real-time reports.

Sales reps can focus on closing deals instead of managing the system itself.

This is what a sales dashboard looks like in Pipedrive:

IaaS SaaS PaaS Pipedrive sales dashboard

Here are some other features that make Pipedrive a useful SaaS tool:

  • Automatic updates and security maintenance. Pipedrive handles all system upgrades and data protection in the background, so businesses always work with the latest features while keeping sensitive information secure.

SaaS systems like Pipedrive save time on technical management, reduce infrastructure costs and give teams more freedom to focus on growth and customer relationships.

Instead of worrying about servers or updates, SMBs can focus their energy on winning new customers and building stronger relationships to drive growth.

With ready-to-use tools, SaaS gives smaller businesses the kind of efficiency and agility that helps them compete with larger players without stretching their budgets or resources.

Platform as a service

PaaS offers developers a ready-to-use platform, combining IT infrastructure with tools like databases, frameworks and runtime environments.

Side note: A runtime environment is part of a system that lets your code run. It provides the necessary software, libraries and settings so applications can operate without needing developers to configure the underlying system.

Teams use PaaS systems to build, test and deploy applications without worrying about managing servers, operating systems or backend maintenance.

This setup enables companies to:

  • Test and iterate efficiently. PaaS provides pre-configured environments for testing new features, launching prototypes or running pilot programs – reducing setup time and minimizing technical errors.

  • Deploy apps seamlessly. Once development is complete, the system quickly deploys applications across multiple environments. The provider also handles scaling and resource management, ensuring reliability and performance.

Popular examples of PaaS providers include Google App Engine and Heroku, which provide:

  • Developer tools such as application programming interfaces (APIs), libraries and deployment pipelines

Here’s how the Google App Engine appears in the Google Cloud:

IaaS SaaS PaaS Google App Engine

SaaS platforms remove the operational burden of managing infrastructure, so developers have more time to focus on creating value for users.

What are the benefits of IaaS, SaaS and PaaS for SMBs?

As SMBs transition from on-premises data centers toward cloud-based solutions, they can leverage IaaS, SaaS and PaaS in different ways depending on their goals and resources.

Each model offers unique advantages that support businesses at different stages:

IaaS

  • Provides access to enterprise-level infrastructure without heavy upfront investment, avoiding the expense of servers and staffing costs.

  • Offers flexible, pay-as-you-go resources that scale up or down to match demand.

SaaS

  • Improves productivity and workflows without needing technical expertise.

  • Ensures predictable subscription costs, automatic updates and cloud access to keep teams productive from anywhere.

PaaS

  • Innovates new apps and features quickly by offering a ready-to-use environment for building and deploying apps.

  • Reduces IT costs, enables easy integrations and frees up resources for other strategic initiatives like nurturing leads or closing high-value deals.

Here’s a real-world example of how a cloud-based SaaS application helped an SMB reach tangible outcomes.

Pipedrive in action: Leadership and training brand Combat Ready used Pipedrive’s CRM to guide projects through key milestones, giving teams a clear visualization of each deal’s progress. The company identified patterns in leads, attendance and logistics, helping the team optimize workflows and deliver more value to customers.

5 key differences between IaaS, SaaS and PaaS

Understanding the differences between IaaS, SaaS and PaaS helps businesses choose the right cloud solution.

Each model balances control, flexibility and technical expertise differently, shaping how companies build and use technology.

Here are five key differences that highlight how these services compare.

1. Level of control

Different cloud models offer varying levels of control, which affects how much technical expertise you need and how quickly you can create or customize new features.

Here’s a breakdown of the control you get with each type of cloud services provider:

IaaS: Maximum control

You manage operating systems, apps and data.

Example: An SMB using AWS configures its own security rules, installs custom software and sets up virtual servers exactly as needed.

PaaS: Moderate control

You focus on code and apps, while the provider manages the backend.

Example: Developers on Google App Engine write and deploy code without worrying about server configuration or runtime management.

SaaS: Least control

You use the software as delivered, with all infrastructure, updates and maintenance handled by the provider.

Example: A sales team using Pipedrive customizes dashboards and sales workflows, but the provider manages servers, security and software updates.

IaaS provides full control for highly customized setups, while PaaS develops apps without managing the backend. SaaS provides ready-to-use software with minimal technical overhead.

2. Primary use case

Each cloud model supports different business needs, so picking the right solution depends on what you want your business to achieve.

Take a look at some of these use cases to see which cloud services are right for your business:

IaaS: Flexible infrastructure for IT teams

Ideal for hosting websites, storage, backup or running virtual machines ( software-based computers that run independently on a physical server, like a Windows VM on AWS).

Example: An e-commerce SMB uses AWS to host its website, securely store customer data and run virtual servers during peak shopping periods.

SaaS: Ready-to-use tools for business users

Great for using business tools like email, CRM or collaboration apps.

Example: A sales team uses Pipedrive to manage leads, track deals and automate email follow-ups while the provider handles updates and security.

PaaS: Rapid development for software teams

Perfect for developing, testing and deploying applications quickly.

Example: A tech startup uses Google App Engine to launch a new mobile app, testing features and iterating quickly without worrying about backend infrastructure.

To sum up, IaaS supports flexible infrastructure needs, SaaS delivers ready-to-use tools for everyday business operations and PaaS speeds up app development.

3. Who uses it

Each cloud model serves different users depending on their technical expertise and business needs.

Here are some examples and use cases of who might use the different cloud services within SMB settings:

IaaS: IT administrators and DevOps teams

These users directly manage servers, storage and networks, configuring systems to meet specific technical requirements.

Example: An IT team at a growing SMB uses AWS to set up virtual servers, manage backups and configure network security.

SaaS: End-users, employees and entire organizations

Anyone in the business can use the software without technical skills, while the provider handles maintenance and updates.

Example: An accounting firm uses QuickBooks Online to manage client invoicing, track expenses and generate reports. The provider handles updates, security and server maintenance.

PaaS: Software developers and engineering teams

Developers focus on building, testing and deploying applications while the platform handles the infrastructure.

Example: A development team uses Google App Engine to create and launch a new web app without managing the backend servers.

IaaS suits technical teams that need full control, while SaaS is ideal for general business users who need ready-to-use tools. PaaS supports developers as they build and deploy apps.

4. Maintenance responsibility

Different cloud models require varying levels of maintenance. This maintenance affects how much time, effort and technical expertise your team needs to invest.

More involvement often allows for greater customization, while less involvement reduces operational overhead.

Here’s how much maintenance each cloud service requires:

IaaS: Full maintenance responsibility

You’re in charge of software updates, patches, security and configuration.

Best for: Businesses that want complete control over their systems and have the technical expertise to manage servers and software.

Example: An SMB using AWS regularly updates its virtual machines, installs security patches and manages software configurations to meet business requirements.

SaaS: Provider handles all maintenance

The provider handles everything, including updates, security and backend systems.

Best for: Businesses that want ready-to-use tools without technical upkeep.

Example: A manufacturing company uses Pipedrive to manage sales pipelines and customer relationships while the provider handles software updates, security patches and server maintenance.

PaaS: Shared maintenance

The provider manages infrastructure and runtime, while you handle your applications.

Best for: Teams that want to focus on building and deploying apps without worrying about backend systems.

Example: Developers on Google App Engine write and deploy code, while the platform automatically maintains the servers, runtime environment and scaling.

IaaS gives full control but requires hands-on maintenance. SaaS removes almost all maintenance responsibilities so teams can focus entirely on using the software. Meanwhile, PaaS reduces technical burden by handling infrastructure while you manage apps.

5. Cost structure

Each cloud model has a different pricing structure, which affects sales budgeting, scalability and how much you pay upfront versus pay-as-you-go.

Understanding the cost structure helps you choose the most cost-effective solution for your needs.

Here’s what to expect when it comes to pricing for IaaS, SaaS and PaaS solutions:

IaaS: Pay for resources consumed

Costs depend on the computing resources you use, such as data storage or network bandwidth.

Best for: Businesses with variable workloads or seasonal demand that want to scale computing infrastructure without large upfront investments.

Example: An e-commerce SMB using AWS pays only for the virtual servers, storage and bandwidth it needs during peak shopping.

SaaS: Pay per subscription or user license

Businesses pay a recurring fee for each user or subscription plan, often monthly or annually.

Best for: Teams that want transparent pricing with minimal setup or infrastructure costs.

Example: A consultancy firm using Pipedrive pays a per-user subscription for its sales team, giving them access to CRM features without worrying about servers or updates.

PaaS: Pay for development environment usage

Pricing depends on the tools and runtime resources your team uses to build, test and deploy applications.

Best for: Development teams who want predictable costs while iterating quickly on apps or prototypes before a product launch.

Example: A startup using Google App Engine pays for the runtime and services used while testing and launching a new mobile app.

IaaS lets you scale resources with usage-based costs while SaaS provides predictable subscription pricing with minimal operational overhead. PaaS ties costs to development activity.

Recommended reading

https://www-cms.pipedriveassets.com/Business-guides.png

Unlocking success: how business guides can transform your operations

When should SMBs use IaaS, SaaS and PaaS?

Knowing when to use IaaS, PaaS or SaaS helps SMBs choose the right cloud solution, saving them time, money and technical headaches.

Below are common use cases for each type of cloud service.

Use IaaS for flexible and scalable infrastructure

IaaS providers give SMBs access to powerful infrastructure without the cost of buying or maintaining physical servers, making it easy to scale resources up or down as business needs change.

For example, an online retailer can increase server capacity during holiday shopping periods and scale back afterward.

This flexibility makes IaaS ideal for several use cases:

Although IaaS offers flexibility, it only works well for companies with some in-house technical expertise to manage configurations and security settings. Monitoring usage is important to prevent unexpected costs from scaling resources too quickly.

SaaS for ready-to-use systems

SaaS products give SMBs access to fully managed software tools that require no installation, maintenance or updates, allowing teams to focus on running the business.

For example, a small financial services firm can use a cloud-based CRM to track client interactions, automate follow-ups and generate reports without needing an in-house IT team.

SaaS works well for several key business needs:

  • Handling accounting, payroll and HR tasks with cloud apps. SMBs can streamline operations while keeping sensitive data secure.

  • Using project management platforms to coordinate teams. Cloud tools allow team members to collaborate, track progress and meet deadlines efficiently.

Download your guide to managing teams and scaling sales

The blueprint you need to find a team of superstars and build a strong foundation for lasting sales success

Typically the most cost-effective option for SMBs, SaaS offers less customization than IaaS or PaaS.

Platforms like Pipedrive, however, let you personalize dashboards, workflows and processes by:

Here’s an example of a custom sales workflow in Pipedrive:

IaaS SaaS PaaS Pipedrive deal workflow

This flexibility lets SMBs tailor the platform to their workflows rather than adapting to a one-size-fits-all system.

Users can also access the Developers’ Corner for advanced integrations. This space provides access to APIs (application programming interfaces) that let your team connect Pipedrive with other software or build custom features.

For example, you can automatically sync data from your accounting system, trigger alerts in your messaging app or create tailored reports that fit your business processes.

This means teams can extend Pipedrive’s functionality to match their workflows without having to manage servers, software updates or backend infrastructure.

PaaS for customizing applications

PaaS lets SMBs build and customize applications without managing the technical backend, making it easier to innovate quickly while managing costs.

For example, a startup can use Google App Engine to test a new mobile app, revise features and launch updates without worrying about server setup or maintenance.

PaaS is ideal for several use cases:

Although PaaS reduces technical burden, there’s a risk of vendor lock-in if you switch service providers later.

“Vendor lock-in” means that once you’ve built your applications or workflows on a particular PaaS provider, it can be difficult or costly to move them to a different provider. This happens because each platform has its own tools, frameworks, APIs and ways of managing data.

Switching might require rewriting parts of your application, retraining staff or adapting integrations, which can be time-consuming and expensive.

Costs can also increase if the platform scales heavily or usage grows unexpectedly.

Recommended reading

https://www-cms.pipedriveassets.com/SaaS-Account-Management.jpg

A complete guide to SaaS account management

IaaS, SaaS and PaaS FAQs

  • A hybrid cloud combines private and public cloud environments so businesses can move workloads between them for flexibility, scalability and cost efficiency.

    Users can deploy IaaS, SaaS and PaaS services across private, public or hybrid cloud environments, depending on their needs.

  • In IaaS, virtualization uses a hypervisor to run multiple virtual machines (VMs) on one physical server. Each VM has its own operating system and apps. For example, a business can host a website, database and test environment on the same server.

    This maximizes hardware use while giving customers scalable, flexible computing resources on demand.

  • AWS Elastic Beanstalk is a platform as a service (PaaS). The solution lets developers deploy and manage applications without handling infrastructure setup or maintenance.

  • A compute engine is a virtual machine service that delivers scalable computing power in the cloud.

    SMBs can use compute engines in IaaS or PaaS to host applications or run analytics without managing physical servers.

  • The Internet of Things (IoT) connects everyday devices to the Internet, allowing them to collect and share data.

    IoT applications typically rely on IaaS, SaaS and PaaS cloud services to process and analyze this data.

  • Load balancing distributes network or application traffic across multiple servers to ensure high availability, prevent overload and improve user performance.

    Load balancing in IaaS, SaaS and PaaS environments helps manage virtual servers and optimize cloud applications and deployments

Final thoughts

IaaS, SaaS and PaaS offer unique advantages, from building infrastructure and developing apps to running everyday operations with minimal technical effort.

Choose the right model by focusing on whether you need maximum control, faster innovation or user-friendly tools.

For many SMBs, SaaS provides the quickest path to value. Pipedrive’s CRM offers instant access to customizable pipelines, dashboards and automation to improve sales processes and close more deals.

Start your free 14-day trial today to simplify sales management without added technical overhead.

Consumer search behaviors are shifting, marketers — new data

Software Stack Editor · September 16, 2025 ·

For what seems like ages, “Google” has been synonymous with “search.” Have a question? Google it. Looking for a product? Google it. But consumer search behavior has changed.

HubSpot's AI Search Grader: See how visible your brand is in AI-powered search  engines.

Now, people are flocking to other channels. Gen Z and Millennials are leading the change, as 29% of the group prefers to search for information on social media over actual search engines.

But that’s not all — generative artificial intelligence (AI) is also coming to search result pages, throwing another wrench in old habits. If your brand relies on search traffic, big consumer shifts are coming (and already on their way). To help you prepare, here are the most significant trends we found after surveying 700+ consumers.

Table of Contents

  • TLDR: How Consumer Search Behavior Is Changing & What Marketers Should Do About It
  • What is consumer search behavior?
  • How Consumer Search Behaviors Are Changing
  • How to Adapt Your Strategy to New Consumer Search Behavior
  • Frequently Asked Questions about Consumer Search Behavior

TLDR: How Consumer Search Behavior Is Changing & What Marketers Should Do About It

Consumer search behavior is rapidly evolving, with users now turning to social media, mobile devices, and AI-powered tools alongside traditional search engines. Recent data shows that over half of Gen Z and Millennials actually prefer social platforms for discovery, while mobile searches continue to outpace desktop.

With these two groups quickly becoming the most powerful market share, marketers need to evolve their search behavior to stay competitive.

This means optimizing content for multiple platforms, prioritizing mobile and local SEO, and preparing for AI-driven search. With HubSpot’s integrated marketing tools, you can start optimizing your search approach today.

What is consumer search behavior?

Consumer search behavior refers to how people discover, research, and find information online before making purchases.

Today‘s consumers don’t just “Google it” anymore. They use social platforms, AI chatbots, voice assistants, and even visual search tools to find what they need. (This has been a big one for me lately.) They read reviews, watch unboxing videos, or do price comparisons.

This shift in consumer search habits demands a new approach to digital marketing strategy — one that meets customers wherever they choose to search.

How Consumer Search Behaviors Are Changing

So, what does consumer search behavior look like in 2025? Let’s break down some of the biggest trends and some telling statistics by category to discuss what it all means for your search behavior marketing.

AI search is on the rise.

1. 72% of consumers report planning on using gen AI-powered search for shopping in the future.

While Google remains the top research destination (more on that later), our research found that consumers plan to search for products more and more on apps like ChatGPT and Perplexity.

In fact, according to GWI, 31% of Gen Zers report they already use AI platforms or chatbots most frequently to find information online, while roughly the same amount also hope to see the research experience only improve.

Add the fact that when researching a brand or product, 59% of consumers prefer to gather information themselves rather than speak to another human, and it’s no wonder experts expect ChatGPT alone to take 1% of the search market in 2025.

Ok, that was a lot of numbers, but I think it makes the picture’s pretty clear.

The days of being able to ignore answer engine optimization (or AEO) are long gone. AI is quickly becoming a part of popular consumer search behavior, and marketers need to react accordingly.

Not sure where to start? First, you’ll want to see how your website, products, and brand currently perform with answer agents. Our free AEO grader will reveal how AI interprets your brand and give you a score out of 100.

screenshot showing hubspot’s aeo grader, a tool to help brands align with new consumer search behavior

Source

It’ll also give you detailed competitive analysis, brand sentiment scoring, and strategic recommendations to improve your score. HubSpot’s Breeze AI in particular can aid your efforts to improve your brand’s AI visibility. (How’s that for meta?)

Social media is increasingly becoming the preferred search channel.

2. 31% of consumers use social media to find answers to their questions.

Our studies found one in three consumers use social search to find answers online. This is actually over double the amount of people who are using AI, and honestly, it’s not a huge surprise.

bar chart showing how consumers search for answers online by percentage

Social media is where people hang out. It gets a bad rap for “brain rot,” but there’s also a wealth of educational and helpful information. From how-tos and life hacks to news, people across every generation are consuming content across some form of social media.

In fact …

3. 29% of Gen Z and millennials prefer social media over search engines.

While just 15% prefer social search over search engines overall, combined, 49% of Gen Z and Millennials prefer social.

bar chart showing how consumer preference for searching on social media over search engines by generation

That’s a significant chunk that will likely only grow, especially as these platforms also incorporate artificial intelligence. (Think Meta AI on Facebook and Instagram, for example.)

When thinking about future strategies, this could be a major shift for marketers as younger generations come into full buying power as they rise in career ranks and generate more income.

Our research shows that B2B marketers plan to invest more in LinkedIn, while B2C marketers are looking to TikTok. Both of these moves reflect how shoppers research new products and services personally and professionally.

Traditional search still reigns supreme.

4. Most consumers still turn to Google first for general search.

All this hype might have you thinking search engines are dying, but SEO teams shouldn’t go into panic just yet – if at all.

While 79% of those who have already used AI for search believe it offers a better experience than traditional search engines, most people still default to Google for general search queries, according to BrightLocal. And that’s not even including Google Maps or users with Google as their default search engine on Safari.

bar chart showing consumers' favorite tool for default general searches by percentage

Source

Only 5% said they default to ChatGPT for general searches, while only 1% use voice assistants. But why? Isn’t AI the new internet darling?

Yes, but not entirely.

Our studies found that one in three consumers uses AI tools like chatbots and ChatGPT, but trust is still very low. In fact, 45% of consumers admit feeling hesitant about AI, considering potential bias, misinformation, and data privacy, among other things.

This is also likely why our research has found consumers still believe search engines are most effective at answering their questions.

bar chart showing how effective consumers believe each search option is by percentage

So, overall, while alternatives are gaining traction and improving functionality, traditional search is still a go-to for consumers looking for answers.

Plus, search engines are incorporating their own AI responses to searches and answer engine optimization (AEO) is still in its infancy. It’s unclear if search rank has an influence on agent mentions and there’s still a chance it does.

Things are changing fast, though. So, we’ll be paying attention.

Mobile search is still popular.

5. 54% of consumers primarily use phones to search.

Consumers we surveyed say they use mobile phones more than any other device when searching for questions online. But, similarly to social search preferences, mobile-first search habits become even more drastic in younger generations.

A whopping 80% of Gen Z use their phones most often when searching, with Millennials (62%) and Gen X (66%) not far behind.

bar chart showing what percentage of consumers use mobile devices for searching over other devices by generation

Our latest Consumer Trends report also shows consumers shop on their phones more than any other device. That’s particularly true for Gen Z, of which 81% use their phone as their primary shopping device.

This mobile-first approach highlights just how critical it’s becoming to optimize web experiences for mobile search platforms and adapt to the preferences of younger generations.

Consumer search is more local than you may think.

6. The majority of consumers say at least 21% of their searches are local-specific.

A study by BrightLocal found, 71% of consumer searches are estimated to be dedicated to local searches. More specifically 32% estimating 21-40% of their searches were local, 24% estimating 41-60%, 11% estimating 61-80%, and 4% estimating 81-100%.

If your business has a specific service area or physical location, localization and local SEO should be a part of your marketing strategy.

7. 1 in 5 consumers conduct local searches directly within maps.

One habit I’ve found myself doing in recent years is using Google Maps to search for places to eat, stay, etc when travelling. I’ll type in the address of where I’m going then zoom in to see what’s close by.

Apparently, I’m not alone.

Google Maps, Apple Maps, and Bing Maps combined make up 20% of default local search platforms for consumers. So, if relevant, you want to make sure your business is set up to appear in results.

8. 1 in 4 of Gen Z consumers use social media as their primary method for local search.

Social media plays a big role in local search as well. With location tags and user-generated content, it’s common for consumers to learn about businesses in their geographic location or those they’re going to be in.

Take me, for example. On Instagram, I have collections where I save places and restaurants I’d like to visit by state, city, or country.

screenshot of instagram collections showing albums organized by location

Visual search is up-and-coming.

9. At least 42% of consumers are somewhat interested in using visual search.

If you’ve been on Google or Amazon lately — and who hasn’t — you’ve likely seen this feature.

screenshot of the google homepage pointing out the “visual search” icon.

Source

It’s a camera icon or photograph on or next to the search bar (like in the screenshot above) that allows users to upload a picture of a physical item they want to learn more about.

This can be useful for a number of different searches. It can identify plants or animals, styles of furniture, or most useful to businesses, show users exactly where they can buy a product like the one in the picture. That was me several times this summer trying to find out where I could buy a specific dress or pair of pants.

According to eMarketer, only about 27% of people are doing the same right now (with Gen Z and Millennials leading the way), but an encouraging 42% are interested in trying it out.

Amazon has also reported a 70% increase in visual searches worldwide year-over-year, while Google gets about 20 billion Lens searches a month, 4 billion related to shopping.

Visual search is growing and with the prevalence of mobile shopping, it can truly be used by marketers to increase conversions and sales.

How to Adapt Your Strategy to New Consumer Search Behavior

Now, understanding these shifts in search behavior is just the beginning. Here’s how to optimize your digital marketing strategy for the evolving search landscape. 

(Dig even deeper in our free AI search guide: “How to Rank on AI Search: 5 Strategies to Stay Visible in the AI Era”)

1. Invest in AEO.

The 2025 State of Marketing revealed that 19% of marketers are building SEO strategies for generative AI search, and nearly half of B2B and B2C (both 47%) marketers have noticed an increase to their web traffic as a result of consumers using AI search.

These numbers are not to be taken lightly. They show a dramatic shift in consumer search behavior and potential competitors’ strategies.

While AI adoption is still emerging, early AEO can help position you ahead of the curve.

Here’s what you can do:

Conduct an analysis of your brand.

First and foremost, you need to assess your brand’s current visibility in AI search, brand sentiment, perception in AI search engines, and how you compare to competitors. I mean, you can’t know how much work needs to be done until you know where you stand currently, right?

A tool like HubSpot’s free AI Search Grader can do this for you.

Study content featured in AI search responses

What’s already showing up in AI agents and engines? Look at who’s “winning” and what their brand is doing that perhaps yours isn’t. You can also use Perplexity, Gemini, and Google’s suggested follow-ups and “People Also Ask” questions to identify gaps in your content marketing.

Analyze AI-generated citations to see where competitors are getting mentioned and examine how AI overviews are structured and formatted.

Structure content for AI comprehension.

Speaking of structure, all the principles of creating high-quality content still apply with AEO. Use clear headers, bullet points, and direct answers to common questions. Optimize for featured snippets and focus on user intent.

Overall, you want to build authority and backlinks to signal to LLMs that you’re a trusted source and expert in your future content marketing. AI systems tend to prioritize credible, well-sourced information.

Pro tip: Create comprehensive topic clusters. AI tools synthesize information from multiple sources, so thorough coverage matters. Learn more about “topic clusters” here.

Build a strong multichannel online presence.

AI models aggregate data from diverse sources, so it’s important to establish a strong presence and reputation as an expert across multiple channels.

Make sure you’re participating in online discussions, monitoring and responding to reviews and feedback, and crafting a compelling narrative around the problems your product solves.

From blogging to social media and analytics. Marketing Hub has all of the tools you need to adapt your marketing strategy to new consumer search behaviors. The best part: You can get started with it for free.

2. Optimize for social search success.

Our recent report found 84% of marketers agree that consumers will search for brands on social media this year. With that in mind, your social media strategy needs a search-first mindset.

Here’s what you should do:

Create searchable content.

Use relevant hashtags, keywords in captions, and descriptive alt text on any visual content. This will help make it easier for algorithms to crawl and retrieve your content for users, as well as index the content for users to find on their own.

Pro tip: Video is the name of the social media game in 2025 — three of the top five most-used social platforms across both B2B and B2C brands are YouTube, Instagram, and TikTok, and these are the platforms driving the most site traffic, social engagement, and audience growth.

Get platform-specific.

Every social media platform has its subtle nuances and features. Optimize for TikTok‘s search algorithm, Instagram’s Explore page, and YouTube’s suggested videos. Also make sure you abide by any technical specifications such as aspect ratio, dimensions, file size, and file type.

Build topic authority.

Consistently create content around your core topics to establish relevance in social algorithms. Not only does this give the platform’s information about what you’re about, but your audience as well.

HubSpot’s social media management tools can not only help you schedule and publish social media content to accomplish these goals, but also create, analyze, and monitor that content.

3. Master mobile-first optimization.

When I first got started in digital marketing, mobile optimization was a big topic of discussion. We preached making sure websites were set up to offer the best user experience from a browser, but today, that’s a big factor in mobile search ranking as well.

With mobile search dominating across all demographics, mobile optimization is non-negotiable.

That means you should:

Focus on site speed.

Aim for page load times under three seconds on mobile devices. Faster websites offer a better user experience, in turn minimizing bounce rates and improving your search rank.

Pro tip: AI can help.

Read: Understanding Technical SEO: Audit Fundamentals + Detailed Checklists

Design for thumbs.

Ensure buttons, links, and interactive elements on your website are easily tappable. Similarly, make sure it’s easy to scroll or swipe through your content.

Prioritize local search.

Mobile searches often have local intent. People are looking for something nearby as they’re on the move. So, be sure to optimize your Google Business Profile and local SEO.

Pro tip: The HubSpot Marketplace is full of free mobile-responsive website templates to help make optimization easy for you.

4. Cater to your target generation.

Remember, while most trends we discussed are consistent across generations, there are subtle nuances that vary.

For example, while all generations are using social media, younger generations are flocking to Instagram and TikTok, while older generations are still enjoying YouTube. Cater your search behavior marketing to the generations you’re trying to reach.

5. Maintain your search engine foundation.

With all the talk about AI and social media, it’s easy to think you can ignore traditional SEO — but that would be a big mistake. Traditional search engines remain the backbone of online discovery. In fact, traditional search rank may even impact AI visibility. It’s still unclear.

Knowing that, continue investing in SEO fundamentals while expanding to new channels. That means continuing to work on your:

  • Technical SEO: Ensure crawlability, site structure, and Core Web Vitals meet standards
  • Content depth: Create comprehensive resources that search engines can confidently recommend
  • User intent alignment: Match content to the specific needs users express through their searches

Frequently Asked Questions about Consumer Search Behavior

What are the 5 stages of the buyer’s journey?

The buyer’s journey typically follows five key stages, each with distinct search behaviors:

  1. Problem Recognition (or awareness): Consumers identify a need and begin broad searches for solutions.
  2. Information search: They actively research across multiple platforms and sources, including possible search engines, social media, or even AI.
  3. Evaluation of alternatives (or consideration): Here, the consumer is comparing options, reading reviews, and seeking recommendations to determine which is the right solution for their needs.
  4. Purchase decision: The consumer has identified the solution they want and are now looking at availability and how to get the best deal.
  5. Post-purchase behavior: Searching for usage tips, support, or sharing their experience in reviews or feedback forms. This also could include making referrals or even a repurchase.

How have consumer search habits changed in recent years?

Consumer search habits have evolved dramatically. While traditional search engines remain dominant, we’re seeing a shift toward multi-platform search strategies. Key changes include the rise of social media search, mobile-first behavior, and emerging AI tool adoption.

Why is understanding search behavior important for marketers?

Search behavior insights directly impact marketing effectiveness. By understanding where and how your audience searches, you can refine your content to improve visibility and connect with consumers at crucial decision moments. This knowledge drives better ROI and helps your brand appear wherever customers look for solutions.

What percentage of consumers use social media for search?

One in three consumers use social search to find answers online. Thanks to enhanced algorithms, hashtags, and even AI assistance, social media can deliver robust answers to users that include content created by peers and sources they trust.

Why is mobile search becoming more important?

Statista reports that over half of global web traffic comes from mobile use, making mobile-first design essential to any marketer and brand. With mobile use being such a prominent consumer search habit, it would be misguided of marketers to neglect mobile optimization in their strategy,

How should marketers adapt to changing search behavior?

Marketers must embrace a hybrid strategy—that includes traditional SEO, Answer Engine Optimization (AEO), and Generative Engine Optimization (GEO)—to remain visible across AI-powered search answers, voice assistants, and conversational tools.

The rise of AI-driven search tools like ChatGPT and Perplexity, now capturing shifting chunks of search traffic, requires marketers to also optimize for AI-first formats and zero-click summaries.

Additionally, including structured data, engaging FAQ formats (like this one), and ensuring accurate, brand-level information support visibility in AI-generated results and voice search and helps position brands to still get found by their target audiences in today’s market.

What role does AI play in future search behavior?

AI-powered search tools are reshaping discovery. Tools like ChatGPT and Perplexity now account for approximately 5.6% of U.S. desktop search traffic as of mid-2025, more than doubling in a year. 

Major players like Google are embedding AI Overviews into search results—reaching billions of users and enhancing user experience, though at the cost of fewer website click-throughs.

This shift demands that brands build content designed for direct citation by AI and cultivate authentic user-generated reviews and community voices, which AI tools increasingly reference.

Which search platforms should businesses prioritize? Which search platforms should brands prioritize for maximum visibility?

This depends on your business, product, and audience, but here are some general guidelines that are worth experimenting with.

Google remains crucial for broad reach, but businesses must also diversify across emerging platforms and search modalities. Social media platforms like TikTok, forums like Reddit, and even AI chat tools like ChatGPT are becoming powerful search destinations, especially among younger or trend-driven audiences.

Additionally, optimizing for voice, visual, and local search — via tools like Google Lens, structured markup, and local business profiles— offers visibility where intent is rich and immediate.

Adapting Your Strategy to New Consumer Search Behavior

In 2025, consumer search behavior is no longer defined by a single platform or habit — it’s multi-channel, contextual, and available on-the-go.

While traditional search engines still anchor the experience and hold great power, social media, AI-powered tools, and mobile-first habits are adding new complexity and dimension. As a marketer, you need to stay flexible and experimental. This vigilance and early adoption is what will keep you relevant and easy to find when consumers go looking.

Editor’s note: This post was originally published in August 2023 and has been updated for comprehensiveness.

B2C vs. B2B marketing with AI: The industry trends every marketer should know

Software Stack Editor · September 16, 2025 ·

The beauty of freelancing for most of my decade-long career is that I’ve worked on both sides of the B2B and B2C marketing coin. One week, I’m helping a B2B SaaS brand rewrite a whitepaper. The next, I’m deep in campaign planning for a B2C real estate brand. It’s a front-row seat to how marketing works across different verticals.

Download Now: The Annual State of Artificial Intelligence in 2025 [Free Report]

Now, with AI, everything has changed. I’ve heard it in interviews with marketing leads, seen it in the tools people reach for, and felt it in the way teams are organizing their workflows.

In this article, I’ll share what I’ve observed, backed by insights from our State of AI in Marketing 2025 report, to compare how B2C and B2B marketers are each leveraging AI and where they’re headed next.

Table of Contents

  • How B2C vs B2B Brands Use AI for Content Creation
  • Top AI Tools Leveraged by B2C vs B2B Brands
  • How B2C vs. B2B Leaders Feel About AI
  • Is B2C or B2B embracing AI more quickly? 

How B2C vs B2B Brands Use AI for Content Creation

Although the use cases of AI are as varied as they come, one thing is clear: AI has become nearly synonymous with content creation. But the way it shows up in B2C versus B2B contexts reveals both strong similarities and subtle differences. And the data from our report makes this very clear.

1. Content Quality Assurance

One of the most widely adopted use cases across both sales models is quality assurance. According to our survey, 53.87% of marketers use AI for things like spellchecks, tone adjustments, accessibility reviews, and writing recommendations. Every marketer knows this is the kind of work that quietly eats up hours in the content cycle.

Personally, I often spend just as much time reviewing as I do writing, checking that every ‘i’ is dotted and every ‘t’ crossed. Now, it is such a relief to be able to handle that part of the process with AI.

2. Copywriting

This was the second most popular use case in our survey, with over half of all marketers saying they use AI to write content. While their content goals may differ, both B2B and B2C marketers rely heavily on written communication.

B2C teams often turn to AI for high-volume writing needs, especially when there’s pressure to churn out lots of content across different channels.

On the B2B side, where content is often required to be in-depth and technical, AI is frequently used more for structure than speed. Here, AI is more relevant for generating outlines, organizing ideas, and sometimes producing a solid first draft.

3. Creating Images With AI Art Tools

Visual content is another growing area for AI support, with nearly half of marketers across both B2C and B2B saying they use AI to create marketing images.

In this case, B2C slightly leads the way. And that’s not surprising, as they often rely heavily on attention-grabbing visuals for social media, digital ads, and branded storytelling, way more than their B2B counterparts.

4. Summarizing Text Into Key Points

I once worked in social media for a B2C brand, and I remember how important it was to take complex or detailed service information and turn it into fun, digestible content for our social media pages. That’s one of many instances where I believe AI could have supported me.

Around 40% of marketers are now maximizing this, using the technology to break down dense content into key points.

For B2C, it’s a shortcut to creating engaging captions, stories, or newsletter blurbs. For B2B, it helps transform long-form assets like reports or webinar transcripts into summaries, executive notes, or even LinkedIn carousel content.

5. Repurposing Content by Format and Audience

Let’s say you’ve shot a customer testimonial video. That same piece of content might need to become a blog post, then a LinkedIn thought leadership article, and maybe even a script for a short video ad. This kind of repurposing, taking one idea and reshaping it across multiple formats, is another space where AI shines for marketers working with B2B and B2C brands.

But it’s not just about changing the format. Many marketers (nearly 40%) also use AI to adapt content for different audiences. For example, turning a blog on male fashion trends into one tailored to women’s styling needs. It’s the same core message, but with language, tone, and focus adjusted to resonate with a new reader.

6. Translating Content Across Languages

Global campaigns demand localized content, and 35% of the marketers we surveyed are using AI to scale their content across languages faster than traditional workflows allowed. B2C brands, especially in ecommerce, use this to localize product pages, ads, and help docs.

B2B teams are also adopting it, particularly for international landing pages, case studies, or product education content. Human oversight still matters, but there’s nothing quite like the head start AI provides.

Top AI Tools Leveraged by B2C vs B2B Brands

When we asked marketers and marketing leaders what AI-related resources their organizations provide to support AI adoption, the most common response — by a clear margin — was subscriptions to AI tools and platforms.

The interesting part?

This trend was evenly distributed between B2B and B2C organizations. That tells us something important: Regardless of audience, industry, or sales model, brands are actively investing in access.

But what tools are marketers actually using in their day-to-day roles? Here’s what stood out over the past 12 months.

1. Image or Design Generators

This was the most used category overall, used by over 40% of marketers. B2C teams are slightly ahead here, which makes sense given their heavier reliance on visual storytelling.

Tools like DALL-E, Canva AI, and Midjourney allow marketers to create entirely new images from text prompts, mock up campaign visuals, or even iterate for ad creatives.

2. General Purpose Chatbots

Chatbots like ChatGPT, Google Gemini, and Microsoft Copilot are arguably the most versatile tools on this list and they come as the second most popular tool. As the descriptor goes, these chatbots can be used for everything ranging from brainstorming, outlining, writing, and summarizing to answering research questions.

3. Smart AI Video and Audio Editing Tools

Video content continues to dominate digital marketing, and the demand for high-quality video assets has never been higher. What’s changed is how easily marketers can create and edit that content using AI.

Now, 36% of marketers, with B2C marketers leading B2B, use tools like Descript, Runway, Pictory, and Wisecut to automatically remove filler words, add subtitles, clean up audio, fix lighting, and even repurpose long videos into shorter clips.

4. Voice and Narration Generators

And then we have voice or narration generators which allow marketers to generate human-sounding voiceovers in different languages, tones, and styles. These tools — like Murf, Speechify, Play.ht, and Soundraw — give marketers the creative range to generate voiceovers and soundtracks without needing a professional studio.

With these generated sounds, marketers can produce video ads, social explainers, or even audio content for apps, product tours, demos, training modules, product tutorials, and presentations. The possibilities are endless.

5. Smart Image Editing Tools

Imagine this: You take a product photo somewhere, but for a specific campaign, it makes more sense on a clean white or seasonal background. This is where AI-powered image editing tools come in.

Over 30% of marketers across both B2C and B2B use image editing tools like Photoshop, Fotor AI, Luminar, and others to enhance, retouch, resize, or remove backgrounds automatically. With these tools, photos are polished quickly and adapted for different uses in record time.

How B2C vs B2B Leaders Feel About AI

Marketers may be deep in the trenches of AI-powered tools, but leadership sentiment is what really signals how organizations are thinking about long-term adoption, and our data reveals a lot.

1. Leaders want more control, not just more tools.

When we asked leaders what’s driving AI adoption, the answers were practical. Top of the list at 23% was better control over data privacy and security. Right behind that at 22% was the ability to customize AI to fit their business needs, and then cost savings at 20%.

These priorities came out nearly evenly between B2C and B2B brands, suggesting that regardless of industry, leaders are trying to bring AI closer to the core of their operations, not keep it as a shiny external add-on.

2. Many leaders see growth potential but they are not fully sold yet.

Roughly 35% of leaders somewhat agreed that AI will help their businesses scale in ways that wouldn’t otherwise be possible.

That’s a moderate vote of confidence, but what’s even more telling is the second most common response: neutrality. Almost 29% neither agreed nor disagreed, which says a lot about where most leaders are right now — interested, but still watching closely.

Maybe they haven’t seen the ROI yet, or maybe they’re wary of betting too heavily on a technology that is still evolving. Whichever it is, we can agree that there is optimism, but it’s cautious.

3. AI is great, but maybe not as great as the Industrial Revolution.

Yet. More than a third of marketing leaders somewhat agree that AI will rival the Industrial Revolution, especially when it comes to the impact it will have on human productivity. And yet, nearly 27% said they neither agree nor disagree — again pointing to this theme of cautious curiosity.

The hype is strong, but leaders may want to see sustained productivity gains across departments, not just faster content. Until then, the comparison to the Industrial Revolution will likely remain a metaphor.

4. Being overly reliant on AI is a red flag.

A clear majority — 65% — of leaders agree that AI should be used in people’s roles, but without them becoming overly dependent on it. This is one of the most widely agreed-upon sentiments across both B2C and B2B, and it reflects something important: Respect for human creativity and critical thinking.

This makes plenty of sense. While there is value in automating the repetitive stuff, the core skills that make marketing work should never be outsourced.

5. The ROI of AI investment is somewhat positive.

The majority of leaders describe the ROI from their AI investments as “somewhat positive.” That’s solid, but not game-changing.

Around 43% are seeing results they feel good about, while only about a third are seeing “very positive” returns. In other words, AI is working — but not blowing minds just yet.

This tracks with how most companies are using AI: to enhance productivity, speed up content production, or unlock small efficiencies.

The takeaway? Leaders aren’t walking away from AI, but they’re not betting the entire farm either.

Is B2C or B2B embracing AI more quickly?

If you’re hoping for a dramatic divide between B2C and B2B when it comes to AI adoption, you won’t find it here. What the data (and conversations with marketers) show instead is that both sides are moving fast, and in surprisingly similar ways.

An astonishing 91% of marketing teams say they already use AI in some capacity, and the split between B2C and B2B is nearly even. The same goes for employee mindset — over half of respondents described their teams as eager to use AI, and again, B2C and B2B are neck and neck.

Even when we asked leaders about future investment in AI tools, the pattern held: Two-thirds of teams plan to increase their AI spend in 2025, with a near-identical number from both sides.

The bottom line? B2C and B2B may be using AI for slightly different tasks, but when it comes to pace of adoption, they’re on the same track — and both are accelerating.

AI does not belong to one type of marketer.

If there’s one thing I’ve learned while writing this piece — and working with both B2B and B2C brands — it’s that AI doesn’t belong to one “type” of marketer. Whether your job is writing enterprise whitepapers or producing viral product videos, the core goals are the same: Be more creative, work more efficiently, and stay relevant.

To do this, marketers are maximizing every tool at their fingertips, which is a very smart thing to do. The tactics may differ slightly, but the momentum is shared.

Effective Psychographic Segmentation in SMB Marketing

Software Stack Editor · September 15, 2025 ·

When SMBs master psychographic segmentation in marketing, campaigns shift from generic to personal. The result is higher engagement, better conversions and sales teams that know which leads to prioritize.

In this article, you’ll learn the definition of psychographics in marketing and how to gather actionable insights into your customers’ motivations, interests and values. You’ll see how to turn that information into practical segments that power your sales and marketing strategies.

Key takeaways from psychographic segmentation in marketing

  • Psychographic segmentation groups customers by motivations and values, not just consumer behavior or demographic data.

  • Combine surveys, behavioral data and social listening to build accurate customer segments.

  • Create three to five segments that are specific enough to guide messaging but broad enough to be actionable.

  • Pipedrive makes it easy to organize psychographic segments with custom labels and track which segments drive the best results – try it free for 14 days.

What is psychographic segmentation in marketing?

Psychographic segmentation divides your audience by their attitudes, interests, motivations and lifestyle.

The purpose is to group people by what matters to them most, so you can personalize campaigns and messages based on their values.

On the other hand, traditional customer segmentation focuses on surface-level data. Demographics groups customers by information like their age or location. Behavioral segmentation groups customers by what they do, like their purchase history or app usage.

Psychographics in marketing reveals what drives customers to act. Using this approach helps you:

  • Improve targeting. Craft messages that resonate with specific motivations and interests.

  • Increase engagement. Connect with audiences on a deeper level, boosting clicks, email opens and interaction.

  • Drive better conversion. Align campaigns with customer values to boost purchases and upselling opportunities.

  • Align sales strategy. Help sales prioritize leads and tailor sales outreach based on segment insights.

  • Boost campaign efficiency. Reduce wasted spend by focusing on the most relevant audience segments.

Psychographics example in marketing: A fitness app targets users who are wellness-focused over those who are achievement-focused. Health-conscious users get messaging about “track your nutrition and optimize your wellness journey”. Status-driven users see “join the community of high-performers and show off your achievements”.

The marketing is for the same app with the same features, but it uses completely different approaches based on what motivates each segment.

Now that you understand what psychographics are in marketing, learn how to extract valuable data to reach and convert your audience.

How to collect psychographic data

To ensure the effectiveness of your psychographic segmentation, you need solid data.

Here are three data collection methods you can combine for a complete picture of your target audience.

Surveys and customer feedback

Questionnaires allow you to ask customers directly about their values, interests and lifestyle choices at scale.

Use tools like SurveyMonkey or Typeform to create and send customer surveys. Ask respondents no more than 10 questions to increase your completion rates (how many people finish your survey).

A mix of quantitative and qualitative questions gives you measurable patterns and a deeper understanding of customer motivations. For example:

Quantitative questions (e.g., ratings)

Qualitative questions (e.g., open-ended questions)

On a scale of 1–10, how important is sustainability when you make a purchase?

What values matter most when you decide to buy from a company?

Rank these motivations in order of importance: saving time, saving money, quality and brand reputation.

What motivated you to choose [product/service]?

On a scale of 1–10, how adventurous would you describe yourself as a consumer?

Describe a time when [product/service] helped solve a challenge for you.

Customer interviews or small focus groups can add depth to survey findings. Speaking directly with your ideal customers helps uncover the stories and emotions behind their choices. The valuable insights you glean make your segments more accurate.

Behavioral tracking and analytics

Rather than segmenting your customer base by how often they use your product or what features they use most, leverage behavioral tracking to uncover patterns that reflect their motivations.

Visiting pages about sustainability might reflect eco-friendly values. Downloading whitepapers might show that a customer feels motivated by learning.

If you use a customer relationship management (CRM) tool, you can link it to behavioral tracking to help you capture these psychographic signals.

For example, Pipedrive integrates with the customer journey tracking and scoring tool Salespanel:

The integration tracks website activity like page visits and downloads, then sends the data to your CRM system.

Social media and third-party data sources

Monitoring conversations your customers have outside of your business helps you understand what drives them in their own words.

Here’s how to do it:

  • Track relevant mentions and topics with tools like Sprout Social or Hootsuite Insights

  • Explore forums like Reddit or see what questions people are asking on Quora

  • Tap into industry reports, related blogs and public market research to spot recurring topics

Say startup product managers are one of your main buyer personas. You follow top creators on LinkedIn and the product management Subreddit, noticing lots of conversations around pain points like budgeting and pricing strategy.

Psychographic segmentation in marketing Reddit research

This information suggests that a “budget-conscious” or “savings-driven” segment could work for your target market.

Recommended reading

https://www-cms.pipedriveassets.com/Psychographics-in-Marketing.png

Psychographics in marketing: the secret to messages that resonate

How to analyze your data to create psychographic segments

Once you have your customer data, follow these four steps to decide what your psychographic segments will be.

1. Identify your customers’ values, interests and motivations

Gather your data in one place, like a Google Doc or Google Sheet, to make it easy to search.

  • If you’ve collected open text like social media comments or qualitative survey answers, look for repeated words and sentiments

  • For quantitative survey data, examine the most common or highest-rated responses. Map those top reactions to categories (e.g., if 70% rank “saving time” as important, include that under the motivation category)

  • Sort your common topics into groups like values (e.g., sustainability, customer trust), interests (e.g., fitness, tech trends) and motivations (e.g., saving time, growing sales revenue)

As this exercise can be time-consuming, you might prefer to feed your data into ChatGPT to sort responses into categories and highlight recurring patterns. Just make sure to check the output for accuracy.

2. Group your customers into actionable segments

Once you’ve categorized your data into values, interests and motivations, look for combinations that naturally occur together.

Example: Imagine you run a project management SaaS platform where 70% customers rank “saving time” as very important. In open answers, many also mention frustration with complex tools. All this feedback points to a clear psychographic profile: efficiency-focused users who want simple solutions.

Choose specific groups to guide messaging, while ensuring they’re broad enough to reach a meaningful number of customers.

For each potential segment, write a brief customer profile that includes:

  • Their primary motivation (e.g., saving time)

  • Key values (e.g., simplicity, ease of use)

  • Common interests or behaviors (e.g., prefer streamlined tools)

  • Audience size (aim for at least 15-20% of your customer base)

You can store these profiles in a shared Google Doc for easy team access or create a simple spreadsheet with columns for each segment attribute.

Use the document as your reference guide when creating personalized marketing campaigns. Visibility helps ensure everyone on your team understands what drives each target segment.

Note: The most powerful segments combine multiple psychographic segmentation variables – such as values, personality traits and lifestyle factors – rather than values alone. The richer your variable mix, the more targeted your messaging will be.

3. Organize your segments

Once you’ve defined your psychographic segments, organize them so your team can act on them.

Simple options include spreadsheets or email lists. A CRM like Pipedrive makes it easier to track engagement and group contacts by segment.

In Pipedrive, you can create contact labels to assign each lead or customer to a segment. For example, you might add labels for “Efficiency-focused users” or “Value-conscious buyers”.

Then, you can assign labels to your contacts in the list view or the contact detail view.

Psychographic segmentation in marketing Pipedrive labels

The label functionality helps sales and marketing teams see at a glance which customers belong to which segments.

4. Assign customers to segments

Now that you’ve defined your segments, decide which customers belong to each one.

Start by reviewing individual customer data against your segment profiles. Look at any survey responses, behavioral patterns and qualitative feedback you have on file to see which segment they match best.

Some customers won’t fit neatly into any segment, and that’s okay. Others may not have in-depth data available to make a clear assignment. Focus on the clear matches first, using these segments as your test group for targeted campaigns.

As you gather more data over time, assign the remaining customers or create additional segments if needed.

Note: Once you establish your segments, you can group new customers from the start by adding one or two psychographic questions to your onboarding process or lead capture forms.

Simple questions like “What matters most when choosing a solution like ours?” can quickly identify which segment new prospects belong to.

The following example shows how campaigns for psychographic segments work in practice.

A real example of psychographic segmentation

The North Face often runs ads showing tough climbs and rugged landscapes, aimed at hardcore outdoor athletes.

The brand used a different angle in this city storefront: “Shoes that help your mind wander.”

Psychographic segmentation in marketing The North Face

Here, the target isn’t mountain climbers. It’s city workers craving balance and relief from office life. The mountains are still in the background, but the hook is about clearing your head, not conquering a peak.

By shifting the message, The North Face connects with stressed professionals who see the outdoors as recovery, not competition.

SMBs can use the same principles in their own campaigns. Say a boutique business retreat company has two key segments:

The hospitality business could create LinkedIn ads with different visuals and messaging tailored to each segment.

To get the ads in front of the right people, it targets the wellness-focused segment using job titles like “Head of People & Culture” and the team-building segment through team lead roles.

This approach makes for more effective marketing campaigns, though marketing isn’t the only department that benefits from psychographic segmentation.

How insights from psychographic segmentation can support sales

The benefits of psychographic segmentation extend beyond marketing and toward sales teams, too. Here’s how psychographics optimizes your SMB sales operations.

It makes decision-making easier when choosing leads to target

Psychographic segments help sales reps spot which leads are most likely to convert.

Instead of treating all prospects the same way, reps can prioritize people who match personality traits linked to previous successful deals.

Take the efficiency-focused users segment from the project management SaaS example. These customers rank saving time as very important and dislike complex tools. For sales, this means:

  • They’re more likely to respond to products with simple, intuitive features

  • Messaging about “quick setup” or “no learning curve” will resonate

  • They may be strong candidates for products designed around ease of use

In Pipedrive, salespeople can filter by label to find the segment with those psychographic characteristics.

Psychographic segmentation in marketing Pipedrive label filter

A targeted approach means reps spend less time on mismatched prospects and more time on genuinely interested leads.

It helps sales teams tailor messages and outreach for stronger responses

Once you know which segment a lead belongs to, shape your outreach so it speaks directly to their motivations.

Generic sales pitches are easy to ignore, while personalized messages show prospects you understand what matters to them.

Pipedrive’s AI email writer customizes your emails automatically, suggesting subject lines and messaging tailored to each lead’s psychographic segment.

Psychographic segmentation in marketing Pipedrive write my email

For efficiency-focused users of a project management SaaS product, this could look like:

  • Sales email subject lines. “Get set up in minutes, not hours” or “Cut admin time in half with [Product]”.

  • Call openers. “I know many product managers tell us they’re frustrated by tools that take too long to learn. Does that sound familiar?”

  • Framing the sales demo. Highlight the fast setup process first before covering advanced features.

Psychographic information makes this level of personalization possible in ways that other types of segmentation can’t match.

Want to Learn How to Influence Your Prospect’s Buying Decisions?

Get inside the head of your customers and take advantage of consumer psychology with this Psychological Selling Guide.

It helps align marketing efforts and sales goals

Psychographic segmentation works best when marketing and sales are on the same page.

When your marketing team knows what motivates your best customers, they can design campaigns that attract similar leads. Sales reps then get prospects who are already warmed up by marketing messages that match their priorities.

In Pipedrive, shared segment data makes this handoff seamless:

  • Marketing can tag new leads by segment (e.g., “efficiency-focused”) as they come in

  • Sales sees those tags in the CRM and knows which angle to lead with during outbound sales calls

  • Both teams can track which segments convert best and adjust campaigns or pitches accordingly

The result is fewer wasted leads, faster follow-ups and a smoother customer journey.

To get the most from psychographic segmentation, it’s also important to know what you should watch out for.

6 common mistakes to avoid with psychographic segmentation in marketing

Psychographic segmentation isn’t an exact science. Your approach will take some trial and error, but here are some key mistakes to avoid.

1. Creating too many micro-segments

If a segment is too small, it will be challenging to act on.

The cost of building dedicated marketing strategies, ad sets or email flows for an audience of only a few dozen people outweighs the return.

Small segments also limit testing and measurement: if only 50 people see a message, you won’t know if the results are meaningful.

Solution: For SMBs, three to five well-defined psychographic segments usually strike the right balance. That’s enough to capture meaningful differences in motivations without making campaigns unmanageable.

2. Assuming psychographic traits never change over time

Customer interests and motivations aren’t fixed.

Someone who values simplicity today might later prioritize sustainability or advanced features as their circumstances or market trends shift.

Ensure your segments are always accurate by:

  • Reviewing your data every six to 12 months using new survey responses, behavioral trends and social listening insights

  • Updating your messaging and campaigns when you notice shifts in attitudes or interests

Keeping your segments up to date ensures your marketing and sales efforts stay relevant.

3. Using assumptions or stereotypes instead of real customer insights

It’s tempting to rely on gut feeling or stereotypes when creating segments, especially if data feels incomplete or time-consuming to collect.

However, assumption-based segments rarely reflect true customer motivations, which can backfire.

Take the earlier project management SaaS example. Say the marketing team assumes that customers value advanced new features, not simplicity, as the survey data shows.

The risks are several:

  • Campaigns might miss the mark. Ads and emails highlighting complex features could confuse or overwhelm the audience

  • Engagement can drop. Customers ignore messages that don’t resonate with their priorities, lowering click-through, email open and engagement rates.

  • Sales teams waste effort. Reps spend time pitching solutions that don’t align with their leads’ needs, slowing conversions

  • Marketing and sales risk misalignment. Teams work off incorrect assumptions, creating inconsistent messaging and a disjointed customer experience

Instead, base your segmentation on real customer data – survey responses, behavioral patterns and qualitative feedback – to ensure your campaigns and sales efforts hit the mark.

4. Overlooking the role of behavior and purchase data alongside psychographics

Psychographics show why customers act, but buying behavior shows what they actually do.

Combining the two makes your segments more accurate and actionable, so it’s essential to map psychographic traits to measurable actions.

For instance, for your efficiency-focused SaaS segment, track which users visit quick-start guides, download productivity whitepapers or open emails with time-saving tips. Each behavior will confirm the segment’s motivation.

Over time, notice which behaviors consistently align with each psychographic segment. This data lets you tailor messaging, campaigns and sales outreach with confidence.

Pipedrive in action: Digital analytics company Quru used Pipedrive’s integration with Leadfeeder to track prospects’ website activity and tailor outreach. By aligning messaging with visitor behavior, Quru increased its deal win rate from 36% to 40%.

As CEO Steve Jackson explains, “People don’t mind being sold to if you solve a relevant problem they have or if you raise an issue they weren’t yet aware of.”

5. Not connecting psychographic insights to measurable business outcomes

Segments only matter if they drive measurable business results, like:

While tracking these outcomes informs whether your psychographic segmentation is improving marketing and sales performance, the opposite leaves you in limbo.

Make sure you tie each psychographic segment to specific marketing and sales KPIs.

For example, you know your efficiency-focused SaaS segment values simplicity and fast setup. Use Campaigns by Pipedrive to track whether emails emphasizing quick onboarding increase conversions compared with a generic message.

Psychographic segmentation in marketing Pipedrive conversion report

By linking segments to measurable outcomes, you can show the real impact of psychographic insights on marketing and sales performance.

6. Not integrating psychographic segments into your CRM

Failing to incorporate psychographic segmentation into a CRM can make your insights invisible and hard to act on.

When you tag and track segments in a tool like Pipedrive, your marketing team can tailor campaigns for each group. Your sales team sees which leads match which segment.

This visibility enables coordinated messaging and a single source of truth for both teams. You can even set up automated sequences or tasks for each segment, ensuring the right messages go out at the right time.

A CRM also makes reporting easier. You measure which segments drive conversions, retention and upsells, ensuring your segments don’t just sit in a spreadsheet awaiting action.

Recommended reading

https://www-cms.pipedriveassets.com/CRM-and-Marketing-Automation-top-tips.png

CRM and marketing automation: key differences, benefits and top integration tips

Psychographic segmentation in marketing FAQs

  • The psychographics definition in marketing segmentation explains the process of dividing audiences by motivations like saving time, social status or quality to create more targeted campaigns.

  • Psychographics reveal what drives customers to purchase, so they can guide SMBs’ decisions around sales and marketing, product development and building brand loyalty.

  • Unlike behavioral, demographic or geographic segmentation, psychographic segmentation groups customers based on the “why” behind their buying decisions.

Final thoughts

Psychographic segmentation gives you insights that demographic segmentation and behavioral segmentation can’t.

By understanding what truly drives your customers, you can create segments that guide messaging, improve targeting and help sales prioritize the right leads.

The end of “Hey {First_Name}”: AI personalization strategies that convert

Software Stack Editor · September 15, 2025 ·

Remember the last time you got an email that started with ‘Hey {First_Name}’ and immediately felt like deleting it? That visceral reaction isn’t just about poor execution — it signals a fundamental shift in buyer expectations.

HubSpot research shows that 78% of customers expect more personalization in business interactions than ever before. Yet only 47% of business leaders say their customer service experiences are highly personalized.

You can no longer rely on old-school personalization tactics like adding basic customer details to a holiday card or making a generic comment like “I love what your company is doing” in your outreach.

Buyers want to feel like their favorite brand understands their underlying needs and motivations. And they’re doing business with those who prioritize deep connection.

Download Now: Free Loop Marketing Prompt Library

The Next Chapter of Personalization

These expectations have raised the bar. You know that “How did they know?” moment when you’re browsing Netflix and the algorithm picks your next binge-watch for you — and actually gets it right?

That’s the new personalization standard that buyers are holding your brand to.

Reaching that level of resonance isn’t possible with old marketing tactics. The good news is that we’re in the age of AI, where traditional marketing strategies have evolved and opportunities for hyper-personalization are endless.

This is where playbooks like HubSpot’s Loop Marketing come in. Businesses need the right tools to adapt to a world where you have access to unlimited information and endless distribution channels — and AI to make sense of it all.

The Loop is the four-stage playbook that helps businesses evolve with customer habits. Here are the stages:

1. Express who you are: Define your taste, tone, and point of view.

2. Tailor your approach: Use AI to make your interactions personal.

3. Amplify your reach: Diversify your content across channels for humans and bots.

4. Evolve in real-time: Iterate quickly and effectively.

Each of these stages is important, but today, we’re focusing on Tailor.

When you combine AI efficiency with human authenticity, you can deliver customer experiences that feel one-on-one at scale. And knowing how to Tailor your messaging effectively is how you get there. Here’s the breakdown.

Tailoring a Custom-Fit Message

Tailoring is about making your content feel personal, not just personalized.

As a brand, you want to leverage your unified customer data — everything from call records to website behavior — to create genuine relevance. That means developing solutions that resonate with both prospects and existing customers.

According to a 2025 HubSpot survey, a whopping 96% of marketers reported that personalized experiences have increased sales.

96% of marketers reported that personalized experiences have increased sales, hubspot 2025 state of marketing report survey

And that’s a big reason why brands like Netflix, Spotify, and Amazon are at the top. They use data about your past behavior to predict your future preferences — whether that’s a TV show, a playlist, or a product recommendation. The more you know about your target customer, the easier it is to meet (and exceed) their expectations.

Delivering that kind of one-to-one relevance starts with the data you use to power your strategy. Here’s what that looks like in practice.

Gathering the Data That Matters

Most businesses are sitting on goldmines of customer data. Customer interactions live in help desk portals, intent signals hide in analytics, and behavior patterns are scattered across platforms.

The tricky part isn’t gathering the data — it’s making sense of it all. If you can’t connect the dots, all of that good data goes unused.

Take this example: You’re doing cold outreach to the VP of Product at a fintech startup. Sure, it’s nice to know basic information like their industry and company size. But what if you also knew that the company just secured another round of funding and is preparing to expand into the SMB market?

That’s the difference between surface-level tracking and enriched intelligence. It’s knowing exactly where each buyer is in their journey and using that context to guide your marketing strategy.

The key to nailing this is using the right tools to bring those scattered signals together. Many of these tools are powered by AI to help you layer context — like firmographics, industry movements, and company news — into your existing contact records.

You can then pull data across your entire tech stack — your CRM, marketing automation, website analytics, even your sales team’s conversation notes — and compile these touchpoints into a single source of truth.

Once your data is unified, the next step is turning those insights into customer profiles you can actually act on.

Moving from Insights to Customer Profiles

With data at the foundation, you can turn your rich, contextual insights into real target audience segments. That means going beyond traditional demographics like “Marketing Manager, 25-35, SaaS.”

Today‘s top marketing campaigns are built around intent and timing instead of job titles and company sizes. Brands are zeroing in on hyper-specific audiences like “Companies showing expansion signals who’ve engaged with competitive content in the past 30 days.”

Instead of using the static audience approach, use AI tools like ChatGPT or Breeze to identify dynamic targets based on real-time behavioral patterns and intent signals.

Here’s one approach: Choose a broad intent category (e.g., “actively evaluating solutions”) and layer in context clues (e.g., pricing page visits, competitor research, email engagement patterns, or subtle signals like increased website time-on-page).

Your prompt will look something like this:

“Find contacts who have shown signs of active solution evaluation in the past 30 days. Include behaviors like pricing page visits, demo requests, or content downloads focused on product ROI.”

The beauty of intent-based segmentation is that your messages land when people are ready to hear them, not when your campaign calendar says it’s time to send them.

Finding the Intersection Where Personalization Meets Connection

True personalization is about meeting your customers where they are with messages that make them stop and think, “Wait, how did they know that?”

Sprinkling “Hey {First_Name}” personalization into an email is so old playbook. If you truly understand your customers, you can connect your solution to their specific challenges and make your marketing feel more like advice from a trusted colleague.

This approach works across all channels. Take landing pages and CTAs as examples. Rather than using one-size-fits-all messaging, try creating variations that speak to different use cases.

You can see this in real time on the HubSpot Blog. Visitors to this email newsletter article will see a different CTA depending on where they are in our contact lifecycle.

New users will see more of an introductory message since they are likely in the early stages of product discovery: “Download now: Free Email Newsletter Guide.”

personalization example, new user cta on hubspot blog

On the other hand, HubSpot customers will see a more personalized one that prompts them to try a specific tool in the HubSpot stack to accomplish a related task: Use HubSpot’s AI Campaign Assistant to Create Email Copy.”

personalization example, existing customer cta on hubspot blog

For email campaigns, you can reference recent company announcements, popular industry trends, or seasonal factors relevant to their business in your copy.

Instead of “Save time with our productivity app,” think “Finally, a way to get through your inbox before your morning coffee gets cold.”

If you get stuck, AI can help kickstart your writing process. But the best results come when you pair AI’s speed with your own judgment and make sure the message still sounds human, relevant, and on-brand.

Leaving Room for the Human Touch

If you’re doing business during the AI era, you’re already at an advantage. From data analysis to content creation, AI is helping teams operate leaner and deliver faster results. And that’s exactly what leadership wants to see: fast results.

The catch? AI tools are incredibly powerful, but they’re not infallible. The most brilliant personalization campaigns may fall flat if AI makes assumptions that aren’t quite right or lacks human judgment about timing and context.

More than half of AI users rely on it for writing. And the top challenges they face boil down to inaccurate information and biased outputs.

That’s why it’s so important to build human quality checks into your process.

The most successful teams treat AI as a superpower that amplifies human creativity and strategic thinking — not as a replacement for it. They build systematic review processes that catch issues before prospects ever see them.

If you’re using AI to generate copy, use the right prompts and designate someone on your team to review the content before it enters the final stages of production.

  • Does the brand voice feel consistent across all the variations?
  • Does the personalization feel natural and helpful?
  • Are the facts about both the customer and your product accurate?
  • Do the CTAs make sense for where this person is in their buying process?

Even with systematic reviews in place, the reality is that some campaigns will still miss the mark. The difference is catching those misses early and learning from them rather than letting your LLM of choice run unchecked.

Creating Personalization at Scale

When you combine rich data, smart segmentation, AI-powered content generation, and thoughtful human oversight, something remarkable happens. Prospects don’t just engage with your content — they build a relationship with your brand.

And at a time when buyers are increasingly skeptical of generic outreach, that human connection is what separates prospects who delete your emails from customers who are enthusiastic about engaging.

Powerful Sales Graph Guide to Boost Revenue

Software Stack Editor · September 15, 2025 ·

Sales teams track dozens of metrics – from lead conversion rates to deal cycle length – but doing it in spreadsheets takes forever. With so much information coming in, it’s hard to spot the patterns that help you hit your targets.

A sales graph changes that by showing your data visually and making it easier to understand. You see trends and make decisions based on clear evidence instead of guesswork.

In this article, you’ll learn how to read sales graphs like an expert, build your own tracking system and present data in ways that impress stakeholders and advance your career.

Key takeaways from sales graphs

  • A sales graph turns spreadsheet data into visual insights that help you spot trends and make faster decisions.

  • Visual data eliminates guesswork by highlighting patterns, seasonal changes and performance gaps that spreadsheets hide in plain sight.

  • Different graphs answer different questions. Use line graphs for performance over time, bar graphs to compare categories and pie charts to see where your revenue comes from.

  • Pipedrive automatically creates these charts from your CRM data, so you spend less time building reports and more time acting on insights. Start your 14-day free trial to see how it saves time and gives you data-backed stories to present to stakeholders.

What is a sales graph and why does it matter

A sales graph is a way to visualize your data. It makes it much easier to understand patterns than scanning through numbers in a spreadsheet.

The main benefit is clarity. When your sales manager asks how Q3 revenue compares to last year, you can reference a line graph instead of calculating percentages. Charts make profit drivers immediately apparent across product lines.

Spreadsheets store your sales data, but graphs make that data easier to interpret.

A spreadsheet might show you sold 150 units in January and 180 in February. A graph makes it clear you’re on an upward trend that could hit 250 units by April if it continues.

How to choose the right sales graph

Different types of graphs have different use cases. Here’s a guide for when to use each type of sales graph in your work.

Use line graphs to track trends over time

Line graphs show how metrics change over time. They help track business growth, conversion rates or any number that moves up and down over weeks or months.

The horizontal axis shows time periods, like months or quarters. The vertical axis shows your sales metric, like revenue or deals closed. Each point on the line represents performance for that specific time.

Here’s an example line graph that’s a combined sales report and forecast:

Sales graph Pipedrive line graph example

The solid line shows actual sales (the sales report part), with revenue on the vertical axis and months along the horizontal axis. The dotted line shows forecasted sales.

Annotations help viewers understand what’s happening, even if they aren’t professional data analysts.

The example above shows the highest and lowest recorded sales, the goal amount and notes that explain dips and why the forecasted sales are so much higher.

Line charts work best for:

  • Tracking sales revenue growth over months or quarters

  • Monitoring conversion rates to spot performance changes

  • Identifying seasonal patterns in your sales

  • Showing progress toward annual targets

  • Comparing this year’s performance to last year’s

They make trends obvious that would take much longer to spot in a spreadsheet.

Use bar graphs to compare performance

Bar graphs compare different categories side by side. Each bar represents a distinct group, like sales reps, products or regions. The height of each bar shows the value, making it easy to see who or what performs best.

For example, a bar graph might show five sales reps on the horizontal axis and their monthly revenue on the vertical axis.

Everyone can see the top performer when presenting to your team without reading the numbers.

Here’s an example bar chart that compares print copies sales to digital sales:

Sales graph Pipedrive bar graph example

Bar graphs work best for:

  • Comparing individual sales rep performance

  • Ranking products by revenue or units sold

  • Measuring different sales territories or regions

  • Showing monthly or quarterly performance side by side

  • Identifying top and bottom performing products quickly

  • Comparing your current period’s results to your targets

You can also use bar graphs to compare the same metric across different periods. For example, your bars might show revenue from Q1, Q2, Q3 and Q4 to see which quarter performed best.

Use pie charts to understand the spread

Pie charts show how your total breaks down into parts. Each slice represents a percentage of the whole, making it easy to see what contributes to your overall sales performance.

For example, a revenue pie chart might show that software sales make up 60% of your business, consulting accounts for 25% and training accounts for 15%.

Here are two pie charts that show how certain products bring in a larger percentage of revenue than others:

Sales graph Pipedrive pie chart example

In the first graph, you can see that Product A makes up the largest share of total units sold, while Product D accounts for the smallest share. Yet in the second graph, it’s clear that Product B and Product A bring in a much larger share of total revenue compared to the number of units sold.

When presenting to stakeholders, this makes it easy to show that some product lines (like Product B) may sell fewer units but generate more revenue, highlighting where the business’s most profitable opportunities lie.

Pie charts work best for:

  • Breaking down revenue by product line or service type

  • Showing lead sources and their contribution to your pipeline

  • Displaying how you allocate time across different sales activities

  • Presenting your company’s market share within your industry

  • Illustrating how you spread the budget across sales initiatives

  • Demonstrating customer segments by value

Pie charts are most effective when you don’t have too many categories. Too many thin slices become hard to read and compare.

Use combo charts to see multiple metrics together

Combo charts combine different graph types to show related metrics at once.

For example, your chart could show your revenue as bars and the conversion rate as a line. If revenue grows but conversion rate drops, you’re probably generating more leads but closing a smaller percentage.

Here’s another example where the bar chart shows revenue (in millions), while the line graph tracks customer acquisition cost over the same period:

Sales graph Pipedrive combination chart example

When presenting this to your manager, this makes it clear that the company is becoming more efficient – bringing in higher revenue while spending less to acquire each customer.

Combo charts work best for things like:

  • Tracking revenue alongside sales KPIs like deal volume or average deal size

  • Comparing actual performance to sales targets on the same chart

  • Showing pipeline value by displaying win rates per month

  • Displaying activity metrics with the results they generate

  • Presenting cost per lead (CPL) alongside lead quality metrics

The trick to combination charts is titling and labeling each part so that it’s clear what’s happening.

Recommended reading

https://www-cms.pipedriveassets.com/Waterfall-charts-for-improved-sales-analysis.png

What waterfall charts can tell you about your sales data

How to read and interpret sales graphs like a pro

Reading a sales graph starts with knowing what to look for. The chart presents the evidence, but you must know how to look for clues, ask the right questions and piece together what’s happening in your sales pipeline.

Here’s what to look for in each type of graph.

Line graphs: identify trends by looking at the direction and momentum

A trend is the overall direction of your data. Simply saying “it’s going up” isn’t enough. The fundamental insight comes from analysing the trend in more detail.

First, analyze the slope (the steepness of the line graph). The steepness tells you the speed of sales growth or decline.

A revenue line trending upward is good, but you also need to look at the growth angle. Is it accelerating or starting to flatten?

Here’s what to look for:

Line graph data analysis

What it means (and what to ask next)

Steeply rising line

Shows rapid growth.

Ask: What did we start doing differently during this period? Was it a new marketing campaign or product launch? Can we replicate this?

Shallow or flat line

Suggests stagnation or slow growth.

Ask: Are we facing market saturation? Is our team hitting capacity? How can we fix this?

Steeply dropping line

Shows that your sales numbers are dropping quickly.

Ask: What’s going wrong? Is a competitor’s product outcompeting ours? How do we reverse the trend?

Next, look for changes in momentum (the curve of the line). If the curve is getting steeper, it’s accelerating. That means your efforts aren’t just adding to your sales, they’re multiplying them.

A steeper curve is always a sign of a scalable sales process.

In contrast, if the curve is getting flatter, you’re losing momentum. It’s a warning sign that, even if your revenue is still growing, you might be reaching a point of diminishing returns.

Sales graph Pipedrive change in subscriptions

A flatter curve tells you it’s time to revisit your sales process, test new tactics or expand into fresh channels to regain momentum.

Finally, look for volatility. If your graph is a smooth, steady line like above, it suggests that you have a predictable sales performance. If it’s a jagged line like the example below, something is inconsistent:

Sales graph Pipedrive jagged line example

In this case, you need to ask why. The fluctuations might be due to seasonal differences or pricing promotions or they could indicate that your sales process needs adjusting.

Bar graphs: compare categories by analyzing heights and gaps

While line graphs show data over time, bar graphs compare different categories at a single point in time.

First, compare the heights of the bars to see which categories are the biggest and smallest:

Bar chart height analysis

What it means (and what to ask next)

One bar is much taller

Shows a dominant performer.

Ask: What makes this salesperson/region/product so successful? How can we apply it to the rest of the team?

Bars are similar in height

Suggests even performance.

Ask: Is our sales training practical? Is this a sign of a healthy team, or can we increase performance?

One bar is much shorter

Shows an underperformer.

Ask: What challenges is this salesperson, region or product facing? Do they need more sales enablement to succeed?

Next, look at the gaps between the tops of the bars. A significant difference between your top performer and everyone else could mean you have a superstar pulling away from the pack.

A narrowing gap suggests that your training programs are working and that other team members are successfully catching up.

When you analyze the heights and gaps, you can quickly spot the strongest and weakest links in your sales efforts and decide where to focus your coaching attention.

Pie charts: understand proportions by looking at slice size

Pie charts show how much each category contributes to the total. To interpret them, you need to compare the relative size of each slice.

Here are a few things to look for:

Pie chart analysis

What it means (and what to ask next)

One dominant slice (over 50% of the total)

Shows a heavy contribution from one thing.

Ask: Are we too reliant on this single product or customer segment? What’s our financial risk if this segment suddenly drops?

A few evenly-sized slices

Suggests a balanced distribution.

Ask: Does this mean our portfolio is well-diversified? Or do we lack a single “killer” product that dominates the market?

Many tiny slivers

Indicates that your efforts are all over the place.

Ask: Are these small customer segments a distraction? Is the effort we put into serving these niche markets worth the small return?

While simple to read, be cautious with pie charts. They become difficult to interpret when there are more than five or six slices.

They’re best for providing a quick, high-level snapshot of your business composition, helping you see where the most significant revenue streams are coming from.

All graphs: investigate outliers and anomalies

Outliers are data points that differ dramatically from the rest of your graph. They’re valuable because they represent something exceptional – either good or bad.

Pinpoint the exact data point. A single bar on a chart that is twice as tall as any other or a point on a line graph that suddenly drops to near zero.

Here’s what to look for:

Sales graph outliers

What it means (and what to ask next)

A huge spike

An unexpected and considerable rise in sales or conversions.

Ask: What caused this and can we do it again? Did one salesperson have a record-breaking month? Was it one enterprise sale that finally closed?

A massive plummet

A sudden, catastrophic drop.

Ask: What can we do to stop the drop? Did a key salesperson resign? Was there a technical issue on our website?

Before you panic or celebrate, rule out simple mistakes. A misplaced decimal point or a problem during data migration can create an outlier that isn’t real. Always verify the source data first.

If it’s real, compare the outlier across different charts to find the reason. For example, if you see a spike in “deals won”, pull up the “new leads created” chart for the last period.

You might find that a marketing campaign created a surge of high-quality leads that caused the sales peak.

Note: Scatter plots are a good way to see data spread. They show each data point as a single dot, letting you see how closely they group (if some are way out of the norm).

How to create a sales graph in Excel

Tracking sales progress is essential for understanding performance. Many build sales graphs using spreadsheet software like Microsoft Excel or Google Sheets.

Creating a sales graph in these apps involves organizing your data with time periods in one column and sales figures in another, then using their built-in charting tools to visualize trends.

For example, here’s how to make a projected sales graph in Excel:

  1. Prepare your data: Set up your Excel sheet with time periods in column A (like Jan, Feb, etc.) and sales values in column B. Keep your periods consistent. If you use months, stick to monthly throughout for an accurate forecast.

  2. Visualize historical performance: Click and drag to highlight all the cells containing your data, including the headers. Press “Insert” and choose “Charts”. Select the “Line Chart” icon, and Excel will generate a chart that shows your sales history.

  3. Add a predictive trendline: Right-click on the line in your new chart and press “Add trendline”. Excel will add a straight dotted line over your data, showing the general trend of your sales.

  4. Extend the trendline to forecast sales: The “Format trendline” menu should appear on the right-hand side when you add the trendline. Look for the “Forecast” section and type the number of future periods (in months if you used months) for Excel to project.

  5. Title and label your graph: Select the “Chart title” and give it a name, like “2025 Sales Forecast”. Next, select the “+” icon next to your chart and check the box for “Axis Titles”. Label the horizontal axis “Sales ($)” and the vertical axis “Month”.

While learning how to create a sales graph in Excel is relatively easy, this manual approach has significant limitations. Every data update requires rebuilding charts, adjusting formulas and reformatting presentations.

For sales teams managing multiple metrics and frequent reporting cycles, this becomes a productivity bottleneck that diverts energy from revenue-generating activities.

How to make a sales graph in Pipedrive

Creating sales graphs in your customer relationship management (CRM) software is faster and better. It already holds your real-time sales data and most CRMs have built-in reporting features that generate graphs automatically.

Pipedrive in action: The BlackTies is a powerful example of how sales reporting helps boost performance.

The high-end magician company struggled to organize sales and follow up on leads.

With Pipedrive’s reporting features, it could finally get a clear view of its sales funnel and conversion rates. Within a year of using Pipedrive, it increased revenue by 120% and doubled its sales lock-in rate.

Here’s how to use Pipedrive’s CRM charts to make essential sales graphs that track your performance.

Track your personal pipeline velocity in Pipedrive

Sales velocity measures how quickly deals move through your pipeline and how much revenue you can expect over a period.

A higher velocity means you’re making more money in less time. Tracking this helps you spot bottlenecks and understand the overall health of your pipeline.

To create a deal velocity report with Pipedrive’s reports and insights feature, navigate to the “Insights” tab on the left-hand sidebar. Click the green “+ Create” and choose “Report”, then select “Deal”.

Pipedrive has a pre-built report for this, which you can find in the list of report types. Choose “Duration”, select the time frame and hit “Save” to finalize the report in your dashboard.

Sales graph Pipedrive deal duration

You can also create reports with Pipedrive’s AI report generator. Click “+ Create” and select “Generate report (AI)”. Type a prompt to tell Pipedrive what kind of report you need or choose from the suggested examples.

Pipedrive’s AI will instantly generate that exact report without you needing to navigate through the menus.

Analyze your lead source performance in Pipedrive

A lead source graph shows which marketing methods generate leads that close. It helps you focus prospecting efforts on the sources that deliver the most promising sales opportunities.

To analyze your lead sources in Pipedrive, go to “Insights”, press the “+ Create” button and choose “Report”. Choose “Deal” and select “Conversion”.

Sales graph Pipedrive lead source analysis

Click the “Segment by” dropdown menu on the right-hand side in the report view. Select the “Lead source” chart template from the list of fields.

Sales graph Pipedrive lead performance

The sales figures will show you the total value or count of deals won, broken down by source.

Monitor your monthly quote progress in Pipedrive

Monthly quote progress shows you how you’re doing against your sales quota. It’s essential for staying on track and knowing how much more you need to close to hit your target.

To create this report, go to “Insights” > “+ Create” > “Report” > “Deals” and choose “Performance”.

Sales graph Pipedrive sales quota performance

Use the filters to set the period to “Monthly” so you’ll only see sales deals closed within the current month.

Next, select “+ Create” > “Goal”.

Sales graph Pipedrive sales goal

Set the “Goal type” as “Deal” > “Won”.

Sales graph Pipedrive deals won

Enter your monthly quote in the “Goal value” field. When you view your “Deals won this month” report on your CRM dashboard, you’ll see your progress against the sales goal you set.

Link your activities to outcomes in Pipedrive

Effort doesn’t always equal results. That’s why linking your activity performance (like calls and emails) to outcomes (like deals won) is crucial.

When you do this in your sales charts, you’ll be able to see which activities are most effective at driving deals forward.

To track sales in Pipedrive, go to “Insights” > “+ Create” > “Report”. Choose “Activities performance” as the report type.

Sales graph Pipedrive activities performance

The report will show a chart showing how many activities you started and how many led to winning a deal. Use the filters to select specific activities (e.g., sales calls or meetings) to analyze.

You might find that, while you make hundreds of calls, the 20 sales meetings you book lead to 90% of your closed deals. You can then focus on securing more meetings.

Download Your Guide to Sales Performance Measurement

The must-read guide for any sales manager trying to track, forecast and minimize risk. Learn how to scale sales with data-backed decisions.

5 best practices for presenting sales graphs

In sales meetings, a graph can be a powerful tool that demonstrates your strategic thinking to your colleagues and managers.

With these best practices, you can turn your simple charts into compelling stories that highlight your insights and make your requests undeniable.

Here’s what to do:

  1. Don’t just report numbers, show sales strategy. Your graph should explain why the data matters. Label your graph clearly so everyone understands what’s happening (and why). It’ll be clear that you know the factors driving sales success.

  2. Focus on a single, powerful message. Powerful graphs make one clear point. Strip away any data that doesn’t support your main argument. To show that Product A is your top performer, compare it to your other products in a simple bar chart.

  3. Translate data to high-level business decisions. Use your graph for future decision-making. Use data visualization to propose a strategic shift, like a new sales process, to show you’re a proactive problem-solver.

  4. Design for clarity and avoid complexity. Avoid distracting effects and colors. Use a simple palette with one highlight color to draw attention to the main point. Add clear labels and titles. The easier it is to read, the more people can act on it.

  5. Know your audience. A graph that impresses your sales manager might confuse executives. Show your audience that you know what information matters most to them.

The goal is to share information quickly, strategize and improve business outcomes.

The more you report sales results in infographics, the easier you find them. Experiment with interactive charts and designs until you find out what works best. With time, you’ll become a seasoned data analyst.

Recommended reading

https://www-cms.pipedriveassets.com/How-to-create-a-data-flow-diagram-to-visualize-your-business-processes.png

The SMB guide to creating a data flow diagram

Sales graph FAQs

  • The best graph depends on your needs.

    Use line graphs for tracking trends, bar graphs for comparing performance and pie charts for breaking up categories into proportions.

  • Sales graphs show you patterns that are hard to spot in spreadsheets full of numbers.

    They eliminate guesswork by making data insights quickly visible so that you can make better decisions.

  • Yes, sales graphs help you see which activities drive revenue.

    You’ll see which lead sources convert best and where you should focus your efforts, helping double down on what works.

Final thoughts

Sales graphs turn complex data into clear insights that drive informed decisions. Whether you track revenue or team performance, the right visual helps you spot opportunities and problems faster.

Start with the metrics that matter most to your business right now. Create simple, focused graphs that answer specific questions about your sales performance.

With Pipedrive, you can track sales metrics and create visual reports that keep your team focused on what drives results. Start your 14-day free trial today and see how much clearer your total sales data becomes.

Capsule CRM vs HighLevel: Which platform is best for your business?

Software Stack Editor · September 14, 2025 ·

image

Looking after your customers is business management 101, but finding the right customer relationship management (CRM) software can feel overwhelming. On the one hand, you have dedicated CRM platforms focused on managing contacts and sales. Alternatively, you’ve got integrated platforms that bundle in a CRM alongside various marketing and communication tools.

Capsule and HighLevel (also known as GoHighLevel) are two very different options. Capsule is a simple yet powerful CRM designed for small to medium-sized businesses, helping teams stay organized and build stronger customer relationships.

HighLevel takes a different approach, providing an all-in-one platform built primarily for marketing agencies that combines basic CRM features with a wide variety of sales and marketing tools.

In this guide, you’ll get to see how Capsule and HighLevel compare across all the most important areas, from the features on offer to how easy they are to use. By the end, you’ll have a clearer picture of which platform is the better fit for your organization.

Capsule and HighLevel plans compared

For small businesses, having access to a free or affordable plan is a low-risk way to try new software and see how it fits into your workflow.

Capsule offers a free plan that includes:

  • Up to 2 users
  • 250 contacts
  • 1 sales pipeline
  • 5 custom fields
  • Contact history & activity log
  • Gmail & Outlook add-ons
  • Android & iOS mobile app

HighLevel doesn’t currently provide a free plan, but you can try it out with a 14-day trial.

When you’re ready to grow, both Capsule and HighLevel offer paid plans. Here’s how their entry-level plans compare:

Capsule Starter plan HighLevel Starter plan

Dedicated CRM

Sales and marketing platform with built-in CRM

$18/user/mo for 30,000 contacts

$97 per month (flat fee)

30,000 contacts

Unlimited contacts

50 custom fields

Unlimited custom fields

1 customizable sales pipeline

Unlimited pipelines

Task and project management

Task management

Gmail/Outlook integration

Email, social (SMS and voicemail billed separately)

Capsule’s Starter plan is designed for growing small businesses. It expands the free plan’s contact limits, adds more customization options, and introduces project boards to help you manage post-sales work. Pricing is predictable because it scales with your team size.

HighLevel’s Starter plan is built for agencies that want more than a CRM. It bundles websites, funnels, and communication tools, while the flat monthly fee means you’ll pay the same whether you��’re a team of two or twenty. However, messaging and calling costs are billed separately, which can make total costs less predictable.

As your business grows and your needs increase, you can take advantage of one of the more advanced plans. Capsule has three additional plan levels, scaling with your business requirements:

HighLevel’s Unlimited plan ($297/month) gives you unlimited sub-accounts, API access, and a branded desktop app

For most SMBs, Capsule offers a clearer and more affordable way to get started, with the flexibility to scale as your needs grow. HighLevel’s pricing makes sense if you’re running a marketing agency and want to manage multiple clients under one roof, but for individual businesses, it’s often more expensive and complex than necessary.

What features and functionality do Capsule CRM and HighLevel offer?

While Capsule and HighLevel both have many similar CRM features, they are very different platforms.

Capsule focuses on being a simple, effective CRM that small and medium-sized businesses can start using right away. You get all of the essential CRM tools you’d need, alongside useful features that help improve your daily work.

Capsule’s core features include:

HighLevel takes a very different approach. It’s an all-in-one marketing and sales platform that bundles CRM functionality alongside a full suite of digital tools. Its features include:

  • CRM and pipeline management. Track customer activity and keep sales opportunities moving forward.
  • Funnel and website builders. Create landing pages and sales funnels to capture and convert leads.
  • Form and survey tools. Collect customer feedback and lead information to understand prospects better and improve campaigns.
  • Booking calendars and appointment scheduling. Enable clients to book meetings online, reducing back-and-forth emails and saving time.
  • Built-in email, SMS, and voicemail. Run campaigns across multiple channels from the same platform (additional fees apply).
  • Competitor analysis and reputation management. Benchmark clients’ online reputation against competitors using real-time review data.
  • White-label branding. Rebrand the platform with your logo and domain.

The key difference between the two platforms is scope. Capsule focuses on being the best CRM it can be, while integrating smoothly with your existing stack. HighLevel packs a wide range of tools into one system, reducing the need for separate apps, but that also means there’s much more to learn and manage.

Which CRM connects best with your existing software?

A CRM is often just one part of your workflow, so how well it connects with the rest of your tools can make a big difference.

Capsule is designed to fit neatly alongside the apps that many small businesses already use. Its App Marketplace offers over 70 integrations, including:

These integrations make Capsule easy to slot into your current setup without having to rethink your existing work processes. The integration with Transpond’s marketing platform is especially useful, keeping your CRM and campaigns in sync so you can manage sign-up forms, run email and social campaigns, and build automations with confidence that you’re always using the most up-to-date contact data.

Capsule also connects with thousands of other apps through Zapier and Make, or you can use the API to build your own unique integrations.

HighLevel builds many tools directly into its platform, from email and SMS marketing to funnel and website builders. However, it also offers integrations with other apps, from social media to ecommerce platforms.

For SMBs who already have preferred tools in place, Capsule’s broad selection of integrations makes it easy to plug in without disruption. HighLevel’s strength is in replacing multiple tools altogether, but that generally means committing to its ecosystem.

Which CRM is best for ease of use?

Ease of use can make the difference between a CRM your team adopts and one that gathers dust.

Capsule is designed with simplicity in mind. Its clean, intuitive layout means you can get started quickly without needing technical expertise. Teams can easily navigate contacts, pipelines, and projects.

One feature that Capsule customers particularly appreciate is how easy it is to import data, whether from spreadsheets or from another CRM using Import2, making setup faster and less stressful.

HighLevel, by contrast, offers more features but also comes with a steeper learning curve. Because it combines so many different tools, new users may find the platform overwhelming at first. To get the most out of HighLevel, you’ll need well-defined processes and the time to set up its many modules properly.

For small businesses that want to get up and running quickly, Capsule is the more straightforward option. For teams willing to invest time and energy into mastering a powerful all-in-one platform, HighLevel has lots to offer, but that investment isn’t necessary for many SMBs.

Which CRM offers more customization and flexibility?

Every business has its own way of working, so it’s important to choose a CRM that can adapt to your processes, rather than forcing you to change the way you work.

Capsule offers users flexibility without complexity. You can tailor Sales Pipelines, create Custom Fields, apply Tags, and set up Workflow Automation to take care of repetitive tasks. The end result is a CRM that you can personalize to your business without requiring a full-time administrator to manage it.

HighLevel offers deeper customization, particularly for agencies. You can build complex automation workflows, brand the platform as your own, and even create a custom app for clients. This makes it highly flexible, but also more demanding. Setting up and managing these customizations requires significant upfront effort.

For most SMBs, Capsule strikes the right balance: enough customization to fit your workflow, but simple enough that you can start seeing results straight away. HighLevel is best suited for agencies that need all the features with white-label flexibility.

Which platform is best for support and security?

When customers trust you with their details, it’s your responsibility to look after that data. As a result, strong support and reliable security are must-haves when choosing a CRM.

Capsule is known for its friendly and responsive support. All customers can access 24/7 AI support, world-class human support, and an extensive knowledge base. The Ultimate plan offers even more help, with priority support, a dedicated account manager, and custom training. Capsule customers regularly highlight how approachable and helpful the support team is, with around 96% of tickets answered within 24 hours.

On the security side, Capsule is SOC 2 Type II certified, encrypts data in transit and at rest, and offers role-based permissions. It’s also GDPR compliant and maintains an uptime record of 99.99%, giving businesses confidence that their data is both secure and accessible.

HighLevel offers 24/7 support through live chat, email, and phone calls. The platform also provides community resources and training for new users.

In terms of security, HighLevel is EU-U.S. Data Privacy Framework certified. However, it does not currently publish its own SOC 2 certification (instead relying on AWS services’ certification), which some businesses may require.

For SMBs, Capsule provides trusted compliance and a responsive support experience that customers genuinely value. HighLevel offers broader availability and resources, but with a focus on agency use cases.

Which CRM is best for my business?

Choosing between Capsule and HighLevel largely depends on the type of business you run and what you need from your software.

Capsule is built for small and medium-sized businesses that want a straightforward CRM to manage contacts, pipelines, and projects without unnecessary complexity. It integrates smoothly with the tools you already use, is easy to set up, and scales affordably as your team grows.

HighLevel is designed primarily for sales and marketing agencies. Its strength lies in providing an all-in-one platform that combines CRM, outreach, websites, funnels, forms, and more. For agencies managing multiple clients, that breadth can be powerful, but for the average business, it often introduces more features and costs than you really need.

For most SMBs, Capsule is the more accessible and cost-effective choice. It delivers the essential CRM features you need without the heavy overhead of an all-in-one platform.

Try any Capsule plan free for 14 days or sign up for our free plan to get started with a simple yet powerful CRM.

HubSpot’s Transactional Email Pricing Guide — Essential Business Communication Add-On

Software Stack Editor · September 12, 2025 ·

HubSpot‘s Transactional Email add-on is a specialized email delivery solution that helps businesses send automated, relationship-based communications like order confirmations, password resets, and account updates through a dedicated IP address.

With seamless CRM integration and unlimited sends that don’t affect your marketing contact limits, Transactional Email ensures reliable delivery of critical customer communications. Here‘s what you need to know about HubSpot’s Transactional Email add-on as of 2025.

HubSpot Transactional Email Add-On Pricing Overview

HubSpot Transactional Email is available exclusively as a premium add-on for Marketing Hub Professional and Enterprise customers:

Component

Monthly Cost

Requirements

What’s Included

Transactional Email Add-On

$600/month

Marketing Hub Pro/Enterprise + Dedicated IP

Unlimited transactional sends, dedicated IP, SMTP/API integration

Additional Dedicated IPs

Contact Sales

Per additional domain

Extra IP addresses for multiple domains

Note: Transactional email requires the purchase of both add-ons and is only available with Marketing Hub Professional ($800/month) or Enterprise ($3,600/month) subscriptions.

What Is HubSpot’s Transactional Email Add-On?

Price: Contact sales for custom pricing

Requirements: Marketing Hub Professional or Enterprise + Dedicated IP Add-On

Email Volume: Unlimited transactional email sends

HubSpot‘s Transactional Email add-on enables you to send automated, essential business communications through a dedicated IP address separate from your marketing emails.

Unlike marketing emails, transactional emails bypass subscription preferences. Transactional emails are delivered regardless of a contact’s opt-in status, making them perfect for order confirmations, password resets, and other transaction-related communications.

The add-on integrates seamlessly with HubSpot‘s CRM, logging all email activity on contact records for complete customer journey visibility.

With API integration capabilities and unlimited sending that doesn’t count against your marketing contact limits, this solution is designed for businesses that need reliable delivery of critical customer communications.

Key Features

  • Unlimited transactional email sends (don’t count against marketing contact limits)
  • Dedicated IP address specifically for transactional emails
  • Immediate IP activation (no warm-up period required)
  • SMTP API and single-send API integration capabilities
  • Custom tokens for personalized customer information
  • Full CRM integration with email activity logging
  • Performance tracking for opens, clicks, and bounces
  • Domain authentication with SPF, DKIM, and custom domain setup

Trade-offs vs Standard Marketing Email

  • Advantage: Unlimited sends, guaranteed delivery regardless of subscription status, dedicated IP protection
  • Cost: Additional monthly fee on top of Marketing Hub subscription
  • Limitation: Content must be transaction-focused, not promotional

Best for: Businesses with e-commerce sites, SaaS applications, or customer portals that must send automated, non-promotional messages triggered by customer actions or system events.

Prerequisites for Transactional Email

Required Base Subscriptions

Marketing Hub Professional

  • Price: $800/month (includes 3 core seats)
  • Additional Seats: $50/month per additional seat
  • Marketing Contacts: 2,000 included

Marketing Hub Enterprise

  • Price: $3,600/month (includes 5 core seats)
  • Additional Seats: $75/month per additional seat
  • Marketing Contacts: 10,000 included

Required Add-Ons

Both add-ons must be purchased together to enable transactional email functionality:

  1. Dedicated IP Add-On: Provides a dedicated IP address for email sending
  2. Transactional Email Add-On: Enables transactional email features and unlimited sending

Technical Requirements

  • Domain ownership and DNS management access
  • Ability to configure A, MX, TXT, and CNAME records
  • Setup of SPF, DKIM, and domain authentication protocols

Key Pricing Considerations

Contact Limits and Cost Savings

Transactional emails don’t count against your Marketing Hub contact tier limits, providing significant cost savings for businesses that send high volumes of transaction-related communications. This separation lets you maintain marketing contact efficiency while ensuring critical business emails reach customers.

Email Send Benefits

Unlike marketing emails with tier-based send limits, transactional emails offer unlimited sending capacity, making them ideal for businesses with unpredictable or high-volume transactional email needs.

Required Add-On Bundle

Both dedicated IP and transactional email add-ons are required together, making this a premium solution designed for businesses with substantial transactional email requirements rather than occasional use.

ROI and Business Impact

Deliverability Benefits

  • Protected Reputation: Dedicated transactional IP prevents reputation damage from marketing campaigns
  • Improved Delivery Rates: Major email platforms filter messages from marketing-first IPs, making dedicated transactional IPs essential
  • Guaranteed Delivery: Transactional emails bypass subscription preferences and quarantine status

Operational Efficiency

  • Unified Platform: Manage all customer communications within the HubSpot ecosystem
  • Complete Tracking: Full visibility into customer email interactions in CRM
  • API Integration: Seamless connection with external systems and applications

Cost Efficiency at Scale

For businesses sending thousands of transactional emails monthly, unlimited sending without marketing contact impact provides substantial cost savings compared to alternative solutions or treating these communications as marketing contacts.

Feature Comparison by Email Type

Feature

Marketing Email

Transactional Email Add-On

Subscription Respect

Yes, honors opt-out preferences

No, bypasses subscription status

Send Limits

Based on contact tier (5x, 10x, 20x)

Unlimited sends

Unsubscribe Link

Required for compliance

Not included (non-promotional)

IP Infrastructure

Shared or dedicated marketing IP

Dedicated transactional IP only

Contact Counting

Counts against marketing limits

Does not count against limits

Content Type

Promotional and nurture campaigns

Transaction and account-related only

Warm-up Required

40 days for dedicated marketing IP

No warm-up, immediate activation

Making the Right Choice

Choose Transactional Email Add-On if:

  • You send automated emails triggered by customer transactions
  • You need guaranteed delivery of critical business communications
  • You want to protect your marketing IP reputation
  • You send high volumes of order confirmations, account alerts, or system notifications
  • You require API integration for external system triggers
  • You need unlimited sending without the marketing contact impact

Consider Alternative Solutions if:

  • You only need occasional transactional emails
  • You don’t currently use Marketing Hub Professional or Enterprise
  • You prefer specialized transactional email services with pay-per-send models
  • You want to minimize platform complexity and cost

Evaluate Your Volume Needs

Dedicated transactional email services might be more cost-effective for businesses sending fewer than 1,000 transactional emails monthly. The unlimited sending and CRM integration often justify the investment for high-volume senders already using Marketing Hub.

Integration and Technical Capabilities

API Integration Options

HubSpot provides comprehensive developer tools for transactional email integration:

  • SMTP API: Generate tokens for third-party system integration
  • Single-Send API: Programmatically send individual transactional emails
  • Direct Send: Create and send emails directly within the HubSpot interface
  • Webhook Support: Trigger emails based on external system events

CRM Integration Benefits

All transactional email activity integrates with HubSpot CRM, providing unified customer communication history across marketing, sales, and service teams without requiring separate tracking systems.

Getting Started

Step 1: Assess Your Requirements

Evaluate your current transactional email needs, including volume, integration requirements, and deliverability challenges with your existing solution.

Step 2: Contact HubSpot Sales

To purchase the transactional email add-on, contact your HubSpot Customer Success Manager or sales representative. They can provide:

  • Custom pricing for both required add-ons
  • Implementation timeline and technical requirements
  • API documentation and integration planning
  • Best practice recommendations for your use case

Step 3: Plan Implementation

Work with HubSpot’s onboarding team to configure DNS records, set up domain authentication, and integrate with your existing systems.

HubSpot offers several support options:

  • Professional onboarding specialists for setup and implementation
  • Technical consulting for complex integrations
  • 24/7 support for troubleshooting and ongoing maintenance
  • Comprehensive developer documentation and API guides

For current add-on pricing or custom enterprise quotes, contact HubSpot Sales at (888) 482-7768 or visit HubSpot’s pricing calculator for estimates based on your specific requirements.

Conclusion

HubSpot’s Transactional Email add-on provides enterprise-grade transactional email capabilities with the unique benefit of unified CRM integration and unlimited sending.

While specific pricing requires custom consultation with HubSpot sales, this solution is designed for businesses already committed to Marketing Hub Professional or Enterprise who need reliable, trackable delivery of essential customer communications.

The requirement for dedicated IP and transactional email add-ons positions this as a premium solution for businesses with substantial transactional email needs. For companies sending high volumes of transaction-related emails, the unlimited sending capability, dedicated IP protection, and seamless CRM integration provide significant operational value that can justify the investment.

Whether you need to send order confirmations for your e-commerce business or automated account updates for your SaaS platform, HubSpot’s Transactional Email add-on ensures your critical communications reach customers reliably while maintaining complete visibility within your CRM ecosystem.

How to get more followers on your business Instagram

Software Stack Editor · September 12, 2025 ·

With more than 1 billion monthly active users, Instagram is one of the most essential social media platforms for marketers and business owners to connect with their audience.

New Data: Instagram Engagement Report [Free Download]

If you’re new to the platform, you’re probably wondering how to get Instagram followers who are genuinely interested in what your business has to offer.

Growing your following takes time and attention, but there are a few things you can do right now to build your Instagram platform.

Let’s dive into the steps you can take to tap into your audience on Instagram and increase your follower count.

Table of Contents

  • How to Get More Followers on Instagram
  • The Best Instagram Apps to Get Followers

1. Don’t buy Instagram followers.

While many social influencers and major brands work hard to build an organic following, some choose to buy followers to increase their social reach and engagement.

Buying followers is cheap; some companies charge less than $5 for hundreds of followers.

However, buying followers and likes can severely damage your brand image and decrease engagement.

For example, Hootsuite created a fake Instagram account and bought 1,000 followers for as little as $15 to test how purchased followers influence audience engagement.

The company received some new followers over the course of a month, but the followers were fake, barely interacted with the content, and were unrelated to the brand.

Furthermore, you risk Instagram removing your account for violating their community guidelines if you buy fake followers.

Moreover, fake followers won’t buy your product or support your brand. Instead, focus on gaining authentic followers to increase your engagement and sales.

2. Create and optimize your Instagram account.

Your Instagram profile should tell your potential followers about your brand, what you do, and why they should follow you. Most importantly, your Instagram should be set up as a business account and not a regular personal account.

To set up a business account on Instagram, follow these steps. Once your business account is set up, you can optimize it to attract followers.

Username

As for your account’s name, start with a recognizable and easily searchable username — like your business name. If your business’ name is already taken, try keeping your business name as the first part of your username so people searching for your business are more likely to come across your account.

For example, the Australian activewear line Lorna Jane uses the username @lornajaneactive.

Screenshot of Lorna Jane Active Instagram page; How to Get More Instagram Followers

Pro tip: Make sure to add your full business name to the “Name” field by clicking “Edit Profile.” This will appear under your profile picture and your username in search.

Public Profile

Make sure your profile is public. To make your profile public, open Instagram, click on the gear icon to open “Options,” and make sure “Private Account” is turned off.

Profile Photo

Choose a profile picture on-brand with your other social networks, like your company logo. Check out HubSpot’s profile picture for reference.

Screenshot of HubSpot Instagram page; How to Get More Instagram Followers

Profile Bio

Fill your bio with delightful, actionable, and informative information about your brand. This lets people know what you’re about and gives them a reason to follow you. Include who you are and what you do, and add a hint of personality. Here are a few examples for inspiration:

  • @WeWork: “For all the #waysyouwork, we’re here #wework
  • @Oreo: “Playful moments from your favorite cookie.”
  • @natgeo: “Experience the world through the eyes of National Geographic photographers.”

Notice the bios are short, to the point, and may include relevant hashtags.

Profile Link

Add a link to your bio to make it easy for people to go straight from Instagram to your website if they want to.

Notifications

Enable notifications to see when people share or comment on your photos so you can engage with them quickly. To enable notifications, go to “Settings” > “Notifications” > “Posts, Stories, and Comments.” Select “From Everyone” for every category.

Pro tip: We don’t recommend you link your Instagram account to Twitter and Facebook, so your Instagram posts are automatically published on those other accounts. The post types are different.

3. Designate a content creator.

There should be one or two people managing your business’s Instagram account. If possible, assign a content creator for your account who has the experience and understands the platform, including all its unique features.

Pro tip: If you work for a large organization, keep an organized guidelines document so your content stays consistent with your brand and that others who want to contribute know what/what not to post.

4. Post high-quality content.

Get familiar with essential photography and videography tips and editing apps. Since Instagram is a mobile app, you’ll likely take most of the photos and videos you post on Instagram on your mobile device. Here are some tips for taking great photos and videos:

  • Focus on one subject at a time.
  • Embrace negative space.
  • Look for symmetry.
  • Capture small details.
  • Capture a variety of angles.
  • Make sure the video or image is clear and steady.
  • Have excellent lighting and avoid grainy imagery.

Pro tip: Instagram also offers a wide range of filters, effects, and tools to make your content stand out, so experiment with different features to see which you like best.

5. Leverage Reels, Stories, and Live videos.

In 2021, the head of Instagram, Adam Mosseri, announced the platform is no longer a photo-sharing app. Since then, Instagram has prioritized video content such as Reels and Stories.

It makes sense, considering videos are more engaging than photos. Our Instagram Engagement Report found that video posts got three times more engagement than photos.

So when you’re creating content for your brand’s Instagram, focus primarily on engaging, dynamic, and interesting Reels and live videos.

For example, the owner of Perfect Pooches Dog Grooming runs an Instagram page called Girl With The Dogs. The page mainly consists of videos showing the behind-the-scenes of pet grooming as well as tips for different breeds of animals.

These Reels are excellent because they showcase the groomer’s work and care for her customers’ pets.

Pro tip: You can also repurpose content from TikTok or YouTube Shorts as Instagram Reels, but avoid any logos from other apps as that can cause the algorithm to show you video to fewer people.

6. Optimize your Instagram Stories Highlights.

Instagram Stories disappear after 24 hours, but you can keep them up indefinitely by sorting them into Instagram Highlights. Highlights are especially useful if you have special, ongoing deals or offers.

Take a look at Sephora’s Instagram and how the company uses highlights to display current offers.

 Screenshot of Sephora's Instagram page; How to Get More Instagram Followers

Sephora’s use of Highlights is a great example because the company’s highlights organize and display different categories of products, such as fragrances and hair care. Furthermore, they have a highlight showing the brand’s values.

Pro tip: When posting Stories, think of ways you can later archive them into Highlights.

7. Post meaningful content.

Post content that is relatable, authentic, and on-brand. This means posting content that highlights your products and services but doesn’t always feel like a direct advertisement.

Look at Dove’s official Instagram as an example. The company post Reels like “Choose a Dove Body Wash with Me” where viewers watch a person go through different body washes to start their morning.

Screenshot of Dove's body wash Reel; How to Get More Instagram Followers

However, the company also posts more heartfelt content, such as a Reel showing different mothers and daughters washing each other’s hair and playing together.

Screen shot of Dove's Reel; How to Get More Instagram Followers

Both videos feature Dove products but in a more humanized and authentic way.

Pro tip: Keep tabs on trending topics, holidays, and social media trends to help you create meaningful and relevant content.

8. Keep a consistent content calendar.

To start posting on Instagram, download this social media content calendar template and plan your Instagram posts.

Over time, you’ll want to build up a backlog of photos for times of need, like the weekends or when you go on vacation.

Keep your target persona in mind when planning your posting schedule, as that can drastically change your posting timing and frequency — especially if you’re targeting an audience in a different time zone.

Optimizing your schedule for your specific audience might take time and experimentation.

According to our State of Social Media Report, the best times to post on Instagram are:

  • 12 p.m. – 2:59 p.m.
  • 3 p.m. – 5:59 p.m.
  • 6 p.m. – 8:59 p.m.

Pro tip: For a United States audience, combine Eastern and Central time zones, as they represent almost 80% of the U.S. population.

For audiences outside the U.S., use whichever time zones your target audience uses.

9. Curate user-generated Instagram content.

Encourage your customers to post content using your products or services and tag your Instagram account.

This will alert you to a new tagged post, and you can repost the content on your own Instagram account or to your Instagram Story.

For example, camera company GoPro often posts content taken by athletes, stunt experts, and active influencers using GoPro cameras.

The Instagram photo below was taken by professional surfer Kai Jenny.

 Screenshot of GoPro's Instagram photo; How to Get More Instagram Followers

Pro tip: Create a brand hashtag customers can use when posting content of your products or services.

10. Optimize your captions for SEO.

Captions are integral to your Instagram because they can showcase your brand voice, double as a call to action, and contextualize your content.

They can also make your posts easier to find when optimized for SEO.

Instagram now allows users to search for content using keywords rather than just usernames or hashtags.

So, be sure to use keywords that align with your brand so your content is easier to find.

For instance, an influencer posted a Reel showing themselves using a concealer by Fyne Cosmetics. The caption included the word “concealer.”

As a result, it was one of the first videos I found when I searched “concealer” in Instagram’s search bar.

Screenshot of an influencer promoting Fyne Cosmetics on Instagram; How to Get More Instagram Followers

Pro tip: To help you find the right keywords, look at other brands within your industry to see what keywords they include in their posts.

11. Use relevant hashtags.

On Instagram, a hashtag ties the conversations of different users who wouldn’t already be connected into a single stream.

If you use relevant hashtags, your posts will get exposure to a broader audience than those who already follow you or know about your brand.

Research relevant hashtags in your niche or industry to find the hashtags your audience might be using. The easiest way to do this research is in the Instagram app, the “explore” tab.

Searching for one hashtag shows you a list of related hashtags at the top of your screen.

For example, I searched #shoes and was given other suggestions, such as #shoeslover #shoesaddict.

Screenshot of Instagram search bar; How to Get More Instagram Followers

Pro tip: Look out for trending hashtags and find ways to incorporate them into your content or create content relating to the hashtag.

12. Interact with your followers.

The most natural way to draw attention to your Instagram account is by interacting with your followers. Like their comments and repost them whenever appropriate.

You should also consider following other accounts that fall within your niche. For example, Nike follows athletes like Grace Geyoro, Chris Mosier, and ShaCarri Richardson.

When another account is notified that you’ve followed them, they might check out your budget and decide whether to follow you.

You’ll also see their recent posts in your feed, so you can like their content and interact with them if you choose to.

Pro tip: As you build a following, celebrate your followers and show you appreciate them by responding to their comments, following them, and engaging with their posts.

13. Cross-promote your Instagram content.

Once you build a solid relationship with some of the folks behind these accounts with a similar audience, you might ask to co-promote each others’ accounts.

The more natural and less spammy you can make the content of these cross-promotions — especially the captions — the better.

It also helps to be picky about them and only cross-promote sparingly.

Below is an example of what that looks like from food blogger @sprinklesforbreakfast and the companies Sweets Indeed and Cookie Cutter Kingdom.

The food blogger posted a video using the companies’ products, promoted their official Instagram in the caption, and tagged them.

Screenshot of Sprinkles for Breakfast Instagram post showing tagged companies; How to Get More Followers on Instagram

14. Run Instagram contests and giveaways.

Another great way to expand your reach while increasing engagement on your Instagram content is to publish a post promoting a contest or giveaway.

In that post, ask people to follow your account and like or comment on the image for a chance to win.

For example, Skinician, a skincare company, hosted a giveaway on its Instagram. To enter, people had to follow the account and tag a friend.

Screenshot of Skinician's Instagram post showing a content giveaway; How to Get More Followers on Instagram

Pro tip: Consider collaborating with another account to run the giveaway. Doing so will introduce your brand to their audience as well.

15. Collaborate with Influencers.

Instagram is the most popular platform for influencer marketing. As mentioned earlier, influencers allow brands to tap into new audiences.

Once you have a strong enough presence on Instagram and you’ve built enough connections, look for influencers whose platform aligns with yours.

For example, if you’re a makeup company, look for makeup or beauty influencers who can promote your products.

If the idea of collaborating with an influencer sounds expensive, consider working with micro-influencers who have a following between 10,000 and 100,000 followers rather than large influencers with millions.

Pro tip: If you’re wondering how to find the best influencers for your brand, click here.

16. Make your Instagram profile easy to follow.

Place a follow button on your website homepage, “About Us” page, blog posts, and other places on your website. If your brand has brick-and-mortar locations, put out an excellent ol’ print call-to-action letting people know you have an Instagram account and encouraging them to follow you.

Also, promote your Instagram account on your other social media accounts. The folks who already follow you on Facebook and Twitter will follow you on Instagram without much prodding.

Let those followers know you’re on Instagram and encourage them to follow you by including a link to your Instagram account in the bios and posts of those other social media accounts.

You’re probably feeling a little overwhelmed. Don’t worry; that’s normal. Creating and managing a new Instagram strategy is a lot of work.

Thankfully, there are some great apps to help your Instagram posts stand out and plenty of apps to help you get followers. We’re going to talk about the latter in this section.

Crowdfire

Crowdfire is a helpful tool for pruning and growing your Instagram following. Pruning your list is as important as developing it, as it helps keep your engagement rates high.

Use Crowdfire to identify inactive followers, send automated direct messages, and discover new followers.

Price: Free

Hootsuite

Hootsuite can help analyze your competition, find the best times to post, and identify opportunities to increase engagement. Use this tool to manage your Instagram campaigns and measure your success.

Don’t miss its handy mobile app for Instagramming on the go.

Price: Paid, but you can try it free for 30 days

Iconosquare

Iconosquare is an all-in-one Instagram analytics, management, and scheduling tool. Use it to track comments on your Instagram profile (and others if you have multiple accounts) and organize a new and curated content library.

Iconosquare also offers an Instagram search engine you can use to discover influencers and cross-promotional opportunities.

Price: Paid, but you can try it free for 14 days

InstaTag

InstaTag shows you which hashtags are trending for the day.

Use this tool to power content with the hashtags most relevant to your brand and products to get your Instagram profile in front of new followers.

Price: Free

Repost

Repost is a “retweet” feature for Instagram; it allows you to easily repost other people’s content (hello, UGC!) while giving credit to the original account.

Repost is an excellent tool for resharing content from customers, followers, employees, and influencers.

Price: Free

Time to Watch Your Follower Count Go Up

Attracting genuine social media followers isn’t easy, but by following these tips and using a few additional apps, you’ll see an improvement quickly.

Give it a shot: Make a profile and start posting, testing, tweaking, and promoting your account.

Garnering a following on Instagram won’t happen overnight, but the stronger a foundation you create on your account in your niche Instagram community, the higher quality your followers will be.

Editor’s note: This post was originally published in June 2023 and has been updated for comprehensiveness.

Microsoft Excel: Easy guide for beginners with formulas and more

Software Stack Editor · September 12, 2025 ·

Microsoft Excel know-how is so expected that it hardly warrants a line on a resume anymore. But how well do you really know how to use it?

Download Now: 50+ Excel Hacks [Free Guide]

Marketing is more data-driven than ever before. At any time you could be tracking growth rates, content analysis, or marketing ROI. You may know how to plug in numbers and add up cells in a column in Excel, but that’s not going to get you far when it comes to metrics reporting.

Do you want to understand what pivot tables are? Are you ready for your first VLOOKUP? Aspiring Excel wizard, read on or jump to the section that interests you most:

Table of Contents

  • What is Microsoft Excel?
  • Microsoft Excel Spreadsheet Basics
  • Keyboard Shortcuts
  • Pivot Tables
  • IF Functions
  • VLOOKUP
  • INDEX MATCH
  • Data Visualization

What is Microsoft Excel?

Microsoft Excel is a popular spreadsheet software program for business. It’s used for data entry and management, charts and graphs, and project management. You can format, organize, visualize, and calculate data with this tool.

Microsoft Excel download image

How to Download Microsoft Excel

It’s easy to download Microsoft Excel. First, check to make sure that your PC or Mac meets Microsoft’s system requirements. Next, sign in and install Microsoft 365.

After you sign in, follow the steps for your account and computer system to download and launch the program.

For example, say you’re working on a Mac desktop. You’ll click on Launchpad or look in your applications folder. Then, click on the Excel icon to open the application.

Microsoft Excel Spreadsheet Basics

Sometimes, Excel seems too good to be true. Need to combine data in multiple cells? Excel can do it. Need to copy formatting across an array of cells? Excel can do that, too.

Let’s start this Excel guide with the basics. Once you have these functions down, you’ll be ready to tackle more pro Excel tips and advanced lessons.

Inserting Rows or Columns

As you work with data, you might find yourself needing to add more rows and columns. Doing this one at a time would be super tedious. Luckily, there’s an easier way.

To add multiple rows or columns in a spreadsheet, highlight the number of pre-existing rows or columns that you want to add. Then, right-click and select “Insert.”

In this example, I add three rows to the top of my spreadsheet.

Microsoft Excel basics: Inserting Rows or Columns

Autofill

Autofill lets you quickly fill adjacent cells with several types of data, including values, series, and formulas.

There are many ways to deploy this feature, but the fill handle is among the easiest.

Microsoft Excel basics: Autofill

First, choose the cells you want to be the source. Next, find the fill handle in the lower-right corner of the cell. Then either drag the fill handle to cover the cells you want to fill or just double-click.

Filters

When you’re looking at large data sets, you usually don’t need to look at every row at the same time. Sometimes, you only want to look at data that fit into certain criteria. That’s where filters come in.

Filters allow you to pare down data to only see certain rows at one time. In Excel, you can add a filter to each column in your data. From there, you can choose which cells you want to view.

To add a filter, click the Data tab and select “Filter.” Next, click the arrow next to the column headers. This lets you choose whether you want to organize your data in ascending or descending order, as well as which rows you want to show.

Let’s take a look at the Harry Potter example below. Say you only want to see the students in Gryffindor. By selecting the Gryffindor filter, the other rows disappear.

Microsoft Excel basics: Filters

Pro tip: Start with a filtered view in your original spreadsheet. Then, copy and paste the values to another spreadsheet before you start analyzing.

Sort

Sometimes you’ll have a disorganized list of data. This is typical when you’re exporting lists, like marketing contacts or blog posts. Excel’s sort feature can help you alphabetize any list.

Click on the data in the column you want to sort. Then click on the “Data” tab in your toolbar and look for the “Sort” option on the left.

  • If the “A” is on top of the “Z,” you can just click on that button once. Choosing A-Z means the list will sort in alphabetical order.
  • If the “Z” is on top of the “A,” click the button twice. Z-A selection means the list will sort in reverse alphabetical order.

Remove Duplicates

Large datasets tend to have duplicate content. For example, you may have a list of different company contacts, but you only want to see the number of companies you have. In situations like this, removing duplicates comes in handy.

To remove duplicates, highlight the row or column where you noticed duplicate data. Then, go to the Data tab, and select “Remove Duplicates” (under Tools). A pop-up will appear so that you can confirm which data you want to keep. Select “Remove Duplicates,” and you’re good to go.

Microsoft Excel basics: Remove Duplicates

If you want to see an example, this post offers step-by-step instructions for removing duplicates.

You can also use this feature to remove an entire row based on a duplicate column value. So, say you have three rows of information and you only need to see one, you can select the whole dataset and then remove duplicates. The resulting list will have only unique data without any duplicates.

Paste Special

It’s often helpful to change the items in a row of data into a column (or vice versa). It would take a lot of time to copy and paste each individual header.

Not to mention, you may easily fall into one of the biggest, most unfortunate Excel traps — human error. Read here to check out some of the most common Microsoft Excel errors.

Instead of making one of these errors, let Excel do the work for you. Take a look at this example:

Microsoft Excel basics: Paste Special

To use this function, highlight the column or row you want to transpose. Then, right-click and select “Copy.”

Next, select the cells where you want the first row or column to begin. Right-click on the cell, and then select “Paste Special.”

When the module appears, choose the option to transpose.

Paste Special is a super useful function. In the module, you can also choose between copying formulas, values, formats, or even column widths. This is especially helpful when it comes to copying the results of your pivot table into a chart.

Text to Columns

What if you want to split out information that’s in one cell into two different cells? For example, maybe you want to pull out someone’s company name through their email address. Or you want to separate someone’s full name into a first and last name for your email marketing templates.

Thanks to Microsoft Excel, both are possible. First, highlight the column where you want to split up. Next, go to the Data tab and select “Text to Columns.” A module will appear with more information. First, you need to select either “Delimited” or “Fixed Width.”

  • Delimited means you want to break up the column based on characters such as commas, spaces, or tabs.
  • Fixed Width means you want to select the exact location in all the columns where you want the split to occur.

Select “Delimited” to separate the full name into first name and last name.

Then, it’s time to choose the delimiters. This could be a tab, semicolon, comma, space, or something else. (For example, “something else” could be the “@” sign used in an email address.) Let’s choose the space for this example. Excel will then show you a preview of what your new columns will look like.

When you’re happy with the preview, press “Next.” This page will allow you to select Advanced Formats if you choose to. When you’re done, click “Finish.”

Format Painter

Excel has a lot of features to make crunching numbers and analyzing your data quick and easy. But if you ever spent some time formatting a spreadsheet, you know it can get a bit tedious.

Don’t waste time repeating the same formatting commands over and over again. Use the format painter to copy formatting from one area of the worksheet to another.

To do this, choose the cell you’d like to replicate. Then, select the format painter option (paintbrush icon) from the top toolbar. When you release the mouse, your cell should show the new format.

Microsoft Excel basics: Format Painter

Keyboard Shortcuts

Creating reports in Excel is time-consuming enough. How can we spend less time navigating, formatting, and selecting items in our spreadsheet? Glad you asked. There are a ton of Excel shortcuts out there, including some of our favorites listed below.

Create a New Workbook

PC: Ctrl-N | Mac: Command-N

Select Entire Row

PC: Shift-Space | Mac: Shift-Space

Select Entire Column

PC: Ctrl-Space | Mac: Control-Space

Select Rest of Column

PC: Ctrl-Shift-Down/Up | Mac: Command-Shift-Down/Up

Select Rest of Row

PC: Ctrl-Shift-Right/Left | Mac: Command-Shift-Right/Left

Add Hyperlink

PC: Ctrl-K | Mac: Command-K

Open Format Cells Window

PC: Ctrl-1 | Mac: Command-1

Autosum Selected Cells

PC: Alt-= | Mac: Command-Shift-T

Excel Formulas

At this point, you’re getting used to Excel’s interface and flying through quick commands on your spreadsheets.

Now, let’s dig into the core use case for the software: Excel formulas. Excel can help you do simple arithmetic like adding, subtracting, multiplying, or dividing any data.

  • To add, use the + sign.
  • To subtract, use the – sign.
  • To multiply, use the * sign.
  • To divide, use the / sign.
  • To use exponents, use the ^ sign.

Remember, all formulas in Excel must begin with an equal sign (=). Use parentheses to make sure certain calculations happen first. For example, consider how =10+10*10 is different from =(10+10)*10.

Microsoft Excel formulas: Simple calculations

Besides manually typing in simple calculations, you can also refer to Excel’s built-in formulas. Some of the most common include:

  • Average: =AVERAGE(cell range)
  • Sum: =SUM(cell range)
  • Count: =COUNT(cell range)

Also note that series’ of specific cells are separated by a comma (,), while cell ranges are notated with a colon (:). For example, you could use any of these formulas:

  • =SUM(4,4)
  • =SUM(A4,B4)
  • =SUM(A4:B4)

Conditional Formatting

Conditional formatting lets you change a cell’s color based on the information within the cell. For example, say you want to flag a category in your spreadsheet.

Microsoft Excel formulas: Conditional Formatting

To get started, highlight the group of cells you want to use conditional formatting on. Then, choose “Conditional Formatting” from the Home menu. Next, select a logic option from the dropdown. A window will pop up that prompts you to provide more information about your formatting rule. Select “OK” when you’re done, and you should see your results automatically appear.

Note: You can also create your own logic if you want something beyond the dropdown choices.

Dollar Signs

Have you ever seen a dollar sign in an Excel formula? When this symbol is in a formula, it isn’t representing an American dollar. Instead, it makes sure that the exact column and row stay the same even if you copy the same formula in adjacent rows.

You see, a cell reference — when you refer to cell A5 from cell C5, for example — is relative by default.

This means you’re actually referring to a cell that’s five columns to the left (C minus A) and in the same row (5). This is called a relative formula.

When you copy a relative formula from one cell to another, it’ll adjust the values in the formula based on where it’s moved. But sometimes, you want those values to stay the same no matter whether they’re moved around or not. You can do that by making the formula in the cell into what’s called an absolute formula.

To change the relative formula (=A5+C5) into an absolute formula, precede the row and column values with dollar signs, like this: (=$A$5+$C$5).

Combine Cells Using “&”

Databases tend to split out data to make it as exact as possible. For example, instead of having data that shows a person’s full name, a database might have the data as a first name and then a last name in separate columns.

In Excel, you can combine cells with different data into one cell by using the “&” sign in your function. The example below uses this formula: =A2&” “&B2.

Microsoft Excel formulas: Combine Cells Using “&”

Let’s go through the formula together using an example. So, let’s combine first names and last names into full names in a single column.

To do this, put your cursor in the blank cell where you want the full name to appear. Next, highlight one cell that contains a first name, type in an “&” sign, and then highlight a cell with the corresponding last name.

But you’re not finished. If all you type in is =A2&B2, then there will not be a space between the person’s first name and last name. To add that necessary space, use the function =A2&” “&B2. The quotation marks around the space tell Excel to put a space between the first and last name.

To make this true for multiple rows, drag the corner of that first cell downward as shown in the example.

Pivot Tables

Pivot tables reorganize data in a spreadsheet. A pivot table won’t change the data that you have, but it can sum up values and compare information in a way that’s easy to understand.

For example, let’s look at how many people are in each house at Hogwarts.

Microsoft Excel Pivot Tables example

To create the Pivot Table, go to Insert > Pivot Table. Excel will automatically populate your pivot table, but you can always change the order of the data. Then, you have four options to choose from.

Report Filter

This allows you to only look at certain rows in your dataset.

For example, to create a filter by house, choose only students in Gryffindor.

Column and Row Labels

These could be any headers or rows in the dataset.

Note: Both Row and Column labels can contain data from your columns. For example, you can drag First Name to either the Row or Column label depending on how you want to see the data.

Value

This section allows you to convert data into a number. Instead of just pulling in any numeric value, you can sum, count, average, max, min, count numbers, or do a few other manipulations with your data. By default, when you drag a field to Value, it always does a count.

Microsoft Excel features: Pivot table example

The example above counts the number of students in each house. To recreate this pivot table, go to the pivot table and drag the House column to both the row Labels and the values. This will sum up the number of students associated with each house.

IF Functions

At its most basic level, Excel’s IF function lets you see if a condition you set is true or false for a given value.

If the condition is true, you get one result. If the condition is false, you get another result.

This popular tool is useful for comparisons and finding errors. But if you’re new to Excel you may need a little more information to get the most out of this feature.

Let’s take a look at this function’s syntax:

  • =IF(logical_test, value_if_true, [value_if_false])
  • With values, this could be: =IF(A2>B2, “Over Budget”, “OK”)

In this example, you want to find where you’re overspending. With this IF function, if your spending (what’s in A2) is greater than your budget (what’s in B2), that overspending will be easy to see. Then you can then filter the data so that you see only the line items where you’re going over budget.

The real power of the IF function comes when you string or “nest” multiple IF statements together. This allows you to set multiple conditions, get more specific results, and organize your data into more manageable chunks.

For example, ranges are one way to segment your data for better analysis. For example, you can categorize data into values that are less than 10, 11 to 50, or 51 to 100.

=IF(B3<11,"10 or less",IF(B3<51,"11 to 50",IF(B3<100,"51 to 100")))

Microsoft Excel formulas: IF Functions

Let’s talk about a few more IF functions.

COUNTIF Function

The power of IF functions goes beyond simple true and false statements. With the COUNTIF function, Excel can count the number of times a word or number appears in any range of cells.

For example, let’s say you want to count the number of times the word “Gryffindor” appears in this data set.

Microsoft Excel formulas: COUNTIF Function

Take a look at the syntax.

  • The formula: =COUNTIF(range, criteria)
  • The formula with variables from the example below: =COUNTIF(D:D,”Gryffindor”)

In this formula, there are several variables:

Range

The range that you want the formula to cover.

In this one-column example, “D:D” shows that the first and last columns are both D. If you want to look at columns C and D, use “C:D.”

Criteria

Whatever number or piece of text you want Excel to count.

Only use quotation marks if you want the result to be text instead of a number. In this example, “Gryffindor” is the only criteria.

To use this function, type the COUNTIF formula in any cell and press “Enter.” Using the example above, this action will show how many times the word “Gryffindor” appears in the dataset.

SUMIF Function

Ready to make the IF function a bit more complex? Let’s say you want to analyze the number of leads your blog has generated from one author, not the entire team.

With the SUMIFS function, you can add up cells that meet certain criteria. You can add as many different criteria to the formula as you like.

Here’s your formula:

  • =SUMIFS(sum_range, criteria_range1, criteria1, [criteria_range2, criteria 2],etc.)

That’s a lot of criteria. Let’s take a look at each part:

Sum_range

The range of cells you’re going to add up.

Criteria_range1

The range that is being searched for your first value.

Criteria1

This is the specific value that determines which cells in Criteria_range1 to add together.

Note: Remember to use quotation marks if you’re searching for text.

In the example below, the SUMIF formula counts the total number of house points from Gryffindor.

Microsoft Excel formulas: SUMIF Function

IF AND/OR

The OR and AND functions round out your IF function choices. These functions check multiple arguments. It returns either TRUE or FALSE depending on if at least one of the arguments is true (this is the OR function), or if all of them are true (this is the AND function).

Lost in a sea of “and’s” and “or’s”? Don’t check out yet. In practice, OR and AND functions will never be used on their own. They need to be nested inside of another IF function. Recall the syntax of a basic IF function:

  • =IF(logical_test, value_if_true, [value_if_false])
  • Now, let’s fit an OR function inside of the logical_test: =IF(OR(logical1, logical2), value_if_true, [value_if_false])

To put it plainly, this combined formula allows you to return a value if both conditions are true, as opposed to just one. With AND/OR functions, your formulas can be as simple or complex as you want them to be, as long as you understand the basics of the IF function.

VLOOKUP

Have you ever had two sets of data on two different spreadsheets that you want to combine into a single spreadsheet?

For example, say you have a list of names and email addresses in one spreadsheet and a list of email addresses and company names in a different spreadsheet. But you want the names, email addresses, and company names of those people to appear in one spreadsheet.

VLOOKUP is a great go-to formula for this.

Before you use the formula, be sure that you have at least one column that appears identically in both places.

Note: Scour your data sets to make sure the column of data you’re using to combine spreadsheets is exactly the same. This includes removing any extra spaces.

In the example below, Sheet One and Sheet Two are both lists with different information about the same people. The common thread between the two is their email addresses. Let’s combine both datasets so that all the house information from Sheet Two translates over to Sheet One.

Type in the formula: =VLOOKUP(C2,Sheet2!A:B,2,FALSE). This will bring all the house data into Sheet One.

Microsoft Excel formulas: VLOOKUP

Now that you’ve seen how VLOOKUP works, let’s review the formula.

  • The formula: =VLOOKUP(lookup value, table array, column number, [range lookup])
  • The formula with variables from the example: =VLOOKUP(C2,Sheet2!A:B,2,FALSE)

In this formula, there are several variables.

Lookup Value

A value that LOOKUP searches for in an array. So, your lookup value is the identical value you have in both spreadsheets.

In the example, the lookup value is the first email address on the list, or cell 2 (C2).

Table Array

Table arrays hold column-oriented or tabular data, like the columns on Sheet Two you’re going to pull your data from.

This table array includes the column of data identical to your lookup value in Sheet One and the column of data you’re trying to copy to Sheet Two.

In the example, “A” means Column A in Sheet Two. The “B” means Column B.

So, the table array is “Sheet2!A:B.”

Column Number

Excel refers to columns as letters and rows as numbers. So, the column number is the selected column for the new data you want to copy.

In the example, this would be the “House” column. “House” is column 2 in the table array.

Note: Your range can be more than two columns. For example, if there are three columns on Sheet Two — Email, Age, and House — and you also want to bring House onto Sheet One, you can still use a VLOOKUP. You just need to change the “2” to a “3” so it pulls back the value in the third column. The formula for this would be: =VLOOKUP(C2:Sheet2!A:C,3,false).]

Range Lookup

This term means that you’re looking for a value within a range of values. You can also use the term “FALSE” to pull only exact value matches.

Note: VLOOKUP will only pull back values to the right of the column containing your identical data on the second sheet. This is why some people prefer to use the INDEX and MATCH functions instead.

INDEX MATCH

Like VLOOKUP, the INDEX and MATCH functions pull data from another dataset into one central location. Here are the main differences:

VLOOKUP is a much simpler formula.

If you’re working with large datasets that need thousands of lookups, the INDEX MATCH function will decrease load time in Excel.

INDEX MATCH formulas work right-to-left.

VLOOKUP formulas only work as a left-to-right lookup. So, if you need to do a lookup that has a column to the right of the results column, you’d have to rearrange those columns to do a VLOOKUP. This can be tedious with large datasets and lead to errors.

Let’s look at an example. Let’s say Sheet One contains a list of names and their Hogwarts email addresses. Sheet Two contains a list of email addresses and each student’s Patronus.

Microsoft Excel formulas: INDEX MATCH

The information that lives in both sheets is the email addresses column. But, the column numbers for email addresses are different on the two sheets. So, you’d use the INDEX MATCH formula instead of VLOOKUP to avoid column-switching errors.

The INDEX MATCH formula is the MATCH formula nested inside the INDEX formula.

  • The formula: =INDEX(table array, MATCH formula)
  • This becomes: =INDEX(table array, MATCH (lookup_value, lookup_array))
  • The formula with variables from the example: =INDEX(Sheet2!A:A,(MATCH(Sheet1!C:C,Sheet2!C:C,0)))

Here are the variables:

Table Array

The range of columns on Sheet Two that contain the new data you want to bring over to Sheet One.

In the example, “A” means Column A, and has the “Patronus” information for each person.

Lookup Value

This Sheet One column has identical values in both spreadsheets.

In the example, this is the “email” column on Sheet One, which is Column C. So, Sheet1!C:C.

Lookup Array

Again, an array is a group of values in rows and columns that you want to search.

In this example, the lookup array is the column in Sheet Two that contains identical values in both spreadsheets. So, the “email” column on Sheet Two, Sheet2!C:C.

Once you have your variables set, type in the INDEX MATCH formula. Add it where you want the combined information to populate.

Data Visualization

Now that you’ve learned formulas and functions, let’s make your analysis visual. With a beautiful graph, your audience will be able to process and remember your data more easily.

Create a basic graph.

First, decide what type of graph to use. Bar charts and pie charts help you compare categories. Pie charts compare part of a whole and are often best when one of the categories is way larger than the others. Bar charts highlight incremental differences between categories. Finally, line charts can help display trends over time.

This post can help you find the best chart or graph for your presentation.

Next, highlight the data you want to turn into a chart. Then choose “Charts” in the top navigation. You can also use Insert > Chart if you have an older version of Excel. Then you can adjust and resize your chart until it makes the statement you’re hoping for.

Microsoft Excel can help your business grow.

Excel is a useful tool for any small business. Whether you’re focused on marketing, HR, sales, or service, these Microsoft Excel tips can boost your performance.

Whether you want to improve efficiency or productivity, Excel can help. You can find new trends and organize your data into usable insights. It can make your data analysis easier to understand and your daily tasks easier.

All it takes is a little know-how and some time with the software. So start learning, and get ready to grow.

Editor’s note: This post was originally published in April 2018 and has been updated for comprehensiveness.

5 Top CRMs for Notaries

Software Stack Editor · September 12, 2025 ·

Managing a notary business involves keeping client details accurate, tasks on schedule and follow-ups consistent. A CRM for notaries can simplify your workflow to reduce admin overhead and help you deliver a professional, reliable service.

In this guide, you’ll learn how CRMs support notaries and discover five tools to streamline your daily operations. You’ll also gain practical strategies to set up your system with confidence.

Key takeaways from CRM for notaries

  • A CRM for notaries is a tool that supports notary operations by centralizing client data, tracking performance and automating tasks.

  • It boosts productivity by streamlining client data management and automating key functions like email communication.

  • Choosing the right management tool helps you save time, keeps you organized and enhances customer experience as your small business grows.

  • A CRM like Pipedrive can help you easily design and manage your notary workflow. Try it out today with a 14-day free trial.

What is a CRM for notaries?

A customer relationship management (CRM) system for notaries is software that helps you organize client information, manage appointments and automate routine tasks in one place.

Instead of juggling spreadsheets, emails and paper notes, you use a single dashboard to track notary workflow step by step. CRMs for notaries often include tools for scheduling and client communication.

For mobile notaries and signing agents, this means spending far less time on admin and being free to focus on billable work and pursue business goals.

Tasks notaries can automate with CRM software

With a CRM, notaries can automate the following tasks right away:

Scheduling and customer management

Keep clients informed by automating confirmation and follow-up emails. Send clients notifications of their upcoming appointments to reduce no-shows.

Document and workflow management

Stay organized by tracking client records and notarization tasks in a single dashboard. Automated workflows replace manual processes, ensuring no detail slips through the cracks.

Centralize documentation

Keep all contracts and important documents in one place by sending trackable files.

Scaling your business

Focus on increasing your caseload or expanding your team while automations handle tedious admin work in the background.

Now that we’ve explored CRM systems’ benefits for notaries, let’s examine some of the top tools available.

Recommended reading

https://www-cms.pipedriveassets.com/CRM-and-Marketing-Automation-top-tips.png

CRM and marketing automation: key differences, benefits and top integration tips

The 5 best CRMs for notaries

We’ve compiled a list of the top 5 CRMs for notaries, considering features, usability and business outcomes.

1. Pipedrive

Pipedrive is an all-in-one CRM built for service businesses that need clear visibility into their client pipeline.

It gives notaries the tools to track clients, manage appointments and automate communication through a simple, visual dashboard.

One of Pipedrive’s strengths is its pipeline view, which allows you to set up stages for every step of your notary process, from booking to signing to payment. As you complete tasks, you can move clients along the pipeline to ensure you never lose sight of where each case stands.

CRM for Notaries Pipedrive Projects

Pipedrive also supports automated reminder emails, follow-ups and task management. These features combine to boost efficiency, improve the client experience and support business growth.

A CRM helps you deliver a consistent, professional customer experience that builds trust, improves loyalty and encourages referrals

Pipedrive in action: GP Law Group, an LA-based personal injury and mass tort litigation firm, used Pipedrive to transform its workflows. Operating more efficiently allowed the firm to scale, doubling its team size and increasing its caseload capability by 160%.

In Australia, Network Financial Planning used Pipedrive to streamline its financial planning operations, boosting efficiency by 50% and growing its team from one to six.

With Pipedrive’s mobile CRM, notaries can update client records, check appointments and send confirmations from their mobile device in seconds.

As your notary business grows, Pipedrive adapts. You can manage more clients, track performance with custom reports and set revenue goals.

Notary businesses that engage in B2B marketing (e.g., to title companies or law firms) can use Pipedrive’s email marketing software to build professional communication funnels and email campaigns.

Key business outcomes with Pipedrive:

  • Full visibility of the client pipeline

  • Time savings with automation

  • A consistent, professional client experience

  • Scalable growth with reports and goals

For notaries who want to look professional while keeping admin light, Pipedrive offers a strong balance of flexibility, automation and ease of use.

Turn Maybe Into Yes With These Killer Follow Up Email Templates

These customizable follow up email templates will help you boost your chances of breaking through to your busiest prospects.

2. NotaryAssist

NotaryAssist is a tool for notaries that focuses heavily on scheduling, invoicing and mileage tracking.

The software offers purpose-built notary features like expense tracking by signing, built-in reminders and templates for common notarial tasks.

CRM for Notaries NotaryAssist

Key business outcomes with NotaryAssist:

  • Reduced scheduling conflicts and no-shows

  • Real-time visibility of income and expenses

  • Simplified tax prep and reporting

You can also use NotaryAssist to send invoices, track payments and generate tax-ready reports.

3. NotaryGadget

NotaryGadget is another notary-specific tool. Positioning itself as accounting software for notaries, it helps streamline invoicing and recordkeeping.

CRM for notaries NotaryGadget UI

The software automatically calculates mileage, logs payments and links expenses to signing events.

Key business outcomes with NotaryGadget:

  • Time savings on recordkeeping and invoicing

  • Accurate financial tracking for each signing

  • Quick and confident tax reporting

Lightweight and simple, NotaryGadget also creates tax reports in just a few clicks.

Start generating quality leads with your B2B Prospecting ebook

This guide will help you find high-quality leads while staying compliant with the rules and regulations.

4. Ontraport

Ontraport is a marketing automation and CRM platform that works well for notaries investing in client outreach.

It combines client management with tools for notary marketing and payment processing.

CRM for notaries Ontraport UI

With Ontraport, you can set up sequences to nurture long-term relationships and track how clients engage with your business.

Key business outcomes with Ontraport:

  • Increasing repeat business and referrals

  • Maximizing sales opportunities

  • Strengthening client relationships

For notaries looking to expand into B2B prospecting, this kind of automation can save hours and increase client loyalty.

5. EasyWeek

EasyWeek is a scheduling-first platform with built-in CRM features.

It’s designed for service providers who want to simplify booking and client communication.

CRM for notaries EasyWeek UI

Notaries can use EasyWeek to publish an online booking page, send confirmations and automate reminders.

Key business outcomes with EasyWeek:

  • Minimize no-shows and booking errors

  • Deliver seamless remote notary services

  • Accept payments with less admin

EasyWeek also offers online payment processing and video conferencing tools that support the delivery of remote notary services.

How to choose the best CRM for your notary business

The best CRM for your notary business is the one that fits your workflow, budget and long-term growth plans.

Here are key factors to keep in mind when evaluating your options.

Prioritize features that support your workflow

More than anything, Notaries need a CRM that makes their everyday tasks easier.

When evaluating systems, start by making a short list of the must-have features for your notary business.

The list might include functionality such as:

If you do a lot of remote work, ensure the system you choose has a strong mobile web version or mobile app. That way, you can update records and confirm appointments on the move.

Prioritizing features that match your daily workflow will help you get the greatest value from your investment.

Consider pricing, scalability and ease of use

Price matters, but so does software’s ability to scale as your business grows.

Start with a plan you can afford, but make sure the CRM offers room to expand as your business handles more signings.

Ease of use is just as important – a simple dashboard could save you time and reduce mistakes instantly, while a steep learning curve would likely slow you down.

Look for helpful integrations and flexible features

Your CRM should work with the tools you already use.

These integrations can make your notary workflow smoother, boosting your CRM’s functionality and saving duplicated effort.

With this in mind, look out for software that connects with solutions like:

Flexibility in CRM is also important, supporting you as your business expands. A CRM that allows you to customize your pipelines, templates and reports will give you scope to adapt without switching tools.

Recommended reading

https://www-cms.pipedriveassets.com/Attorney-Invoice-Software-solutions.png

How to choose the right attorney invoicing software: 5 top recommendations

3 steps to set up a CRM for your notary business

Getting started with a CRM shouldn’t be overwhelming.

Following a few clear steps will help you set up your system and start seeing value immediately.

1. Import contacts and set up your workflow pipeline

Once you’ve chosen a CRM, import your client data.

Most systems let you upload contacts from spreadsheets or sync them from your email.

Next, create a pipeline that reflects your workflow. For example, your stages might include:

  • “New inquiry”

  • “Appointment booked”

  • “Signing completed”

  • “Payment received”

Setting up a clear pipeline ensures you track every client from first contact to final payment.

Download your free business continuity plan template

Prepare your own business continuity plan using this free spreadsheet

2. Automate routine tasks

With your workflow pipeline in place, you can set up automations to handle repetitive admin work in your notary business.

Depending on your priorities, you might want to start by setting triggers for client reminders, booking confirmations or follow-up emails.

If you run a large notary business or work in a team, you can use the CRM to assign tasks to other team members. Here’s an example in Pipedrive:

CRM for Notaries assigning tasks

By prioritizing the tasks that currently take the most time, you can gain some “quick wins” from your new CRM and free up some time immediately.

3. Track performance with the software’s reporting tools

The final step of setting up a notary CRM is familiarizing yourself with the software’s reporting features.

Depending on the CRM’s functionality, you may be able to generate reports on metrics like:

For example, you can use Pipedrive to generate a deal revenue forecast:

CRM for notaries Pipedrive deal revenue forecast

Reviewing relevant business data regularly allows you to spot trends, set goals and make better decisions.

Recommended reading

https://www-cms.pipedriveassets.com/Guide-to-integrating-AI-into-CRM.png

Integrating AI into CRM: benefits and step-by-step guide

Sample notary workflow using a CRM

Notaries can use CRMs in various ways, but they will likely return to certain workflows repeatedly. Let’s look at a typical workflow, using Pipedrive as an example.

Step 1: Booking

Imagine a busy notary, Maria, who handles five to six appointments a day.

Her day starts with booking. One client schedules a power of attorney signing online, while another calls to set a last-minute appointment.

Maria enters both appointments into Pipedrive using the software’s scheduling tool.

CRM for Notaries meeting scheduler

The system automatically stores client names, contact info and appointment times.

Maria can also use Pipedrive to record special instructions, like notarizing multiple documents or verifying ID types.

Step 2: Appointment

Before each meeting, Maria prepares for the appointment by reviewing the client’s record in Pipedrive.

CRM for Notaries client's record

She checks which documents need notarization, confirms the client’s ID requirements and notes any special instructions.

Step 3: Notarization

During notarization, Maria logs each document the client signs. She seamlessly sends copies of the document to the client using Pipedrive’s Smart Docs feature and uses a payment and tracking tool integration to record the payment directly in Pipedrive.

If the client pays online, the system automatically updates the payment status.

Step 4: Follow-up

With notarization complete, Maria moves to follow up.

She uses a follow-up email template to send an automated thank-you email to her client.

CRM for Notaries email templates

Pipedrive reminds Maria of any follow-up tasks, such as scheduling a future appointment or sending additional forms.

By the end of the day, all of Maria’s client records are current, and she has a clear snapshot of her upcoming appointments.

CRM for notaries FAQs

  • Even if you work alone, a CRM can help you save time and stay organized as you work through your caseload.

    The automations in notary CRMs mean you have less admin to tackle manually and more time to spend on delivering an excellent service.

  • CRM pricing varies by product, features and number of users. Basic plans are designed to be affordable for solo notaries, while advanced tiers support larger teams.

    Most providers offer monthly or annual subscriptions. Pipedrive’s pricing plans illustrate how cost can scale with functionality.

  • Yes. Pipedrive and many other CRMs support remote access, secure client communication and integration with online appointment scheduling and e-signature tools.

    This functionality allows notaries to manage appointments, track their tasks and keep client data organized from any location with internet access.

Final thoughts

With a robust CRM, you can keep your notary business organized, reduce the time you spend on repetitive tasks and help clients feel informed and valued.

The software handles the routine work so you can focus on delivering excellent service and pursuing your business goals.

Whether you’re a solo notary or growing a mobile signing business, a CRM helps you work accurately and efficiently. Start your free 14-day trial of Pipedrive today.

Capsule CRM vs Folk CRM: Which one is best for your business?

Software Stack Editor · September 11, 2025 ·

image

Whatever kind of business you’re in, strong customer relationships are vital if you want to enjoy long-term success.

Unfortunately, choosing the right customer relationship management (CRM) software isn’t always so straightforward. For small businesses in particular, the ideal CRM needs to balance value with ease of use, while still offering the features that help you grow and stay organized.

Capsule CRM and Folk CRM are two popular options, both offering ways to manage your contacts and sales pipelines, but they also have some significant differences that can impact your results.

In this guide, you’ll get to see how Capsule and Folk compare across key areas like pricing, features, integrations, ease of use, and customer support. By the end, you’ll have a clearer picture of which CRM will work best for your business.

Capsule and Folk plans compared

For most small businesses, getting the right balance between affordability and features is crucial. A CRM that’s too costly or complicated to scale can quickly become more of a burden than a benefit.

Capsule’s Free plan gives you access to all the essentials, making it easy for small teams to get started with a new CRM. The plan includes:

  • 2 users
  • 250 contacts
  • 25 custom fields
  • 1 sales pipeline
  • Project management
  • Gmail and Outlook integrations
  • Android and iOS mobile app.

Folk, by contrast, doesn’t have a free plan. Instead, you can sign up for a 14-day trial of any paid plan. Once the trial ends, you’ll need to upgrade to continue using the platform.

Here’s how the entry-level paid plans compare:

Capsule Starter plan Folk Standard plan

$18 user/month

$20 member/month

30,000 contacts

2,000 emails per month per member

50 custom fields

500 enrichments per month

Sales pipeline dashboard

1 synced account per member

Project board

Basic campaign sequences

As you compare the paid plans, it becomes clear that Capsule and Folk take different approaches to CRM software. We’ll dive into the specific features in more detail in the next section, but for now, let’s focus on how the plans are structured.

Capsule is designed to help you manage every aspect of your customer relationships, with different ways to manage your contacts and Sales Pipelines. The Starter plan provides generous contact and field limits, alongside reporting and a Project Board to help manage work after you close the deal. At a slightly lower price point, it’s designed to grow with your business.

Folk places more emphasis on customer engagement, with plans based around contact enrichment and email outreach. The Standard plan includes unlimited contacts, and each member can reach out to those contacts with up to 2,000 messages. However, certain features you might expect to see as standard (such as deal tracking or measuring performance with dashboards) require a more expensive plan.

At the higher tiers, both platforms expand in different ways. Capsule’s Growth plan and above add on Workflow Automation, multiple Pipelines and Project Boards, advanced Sales Analytics, and hands-on Customer Support. The top-tier Ultimate plan adds a dedicated account manager and custom training, all at a predictable cost per user.

Folk’s Premium and Custom plans increase campaign and enrichment limits, add dashboards, WhatsApp sync, and advanced user roles. The Custom tier is priced from $80 per user/month, targeting teams that need heavy-duty outreach capacity and dedicated support.

For budget-conscious small businesses, Capsule’s free plan and affordable entry point make it the safer, longer-term option. Folk’s trial is useful for testing advanced outreach features, but ongoing access requires a paid subscription from the outset.

What features and functionality do Capsule and Folk offer?

While both Capsule and Folk are CRMs, the way they approach customer management is quite different.

Capsule focuses on giving small and medium-sized businesses a simple but powerful toolkit for managing relationships across the entire customer journey. Folk is more specialized, leaning toward agencies and outbound teams that need to capture leads quickly and run coordinated campaigns.

Capsule’s key features include:

Folk’s standout features include:

  • FolkX Chrome extension. Capture leads directly from LinkedIn and other websites in one click
  • Sequences and campaign tools. Create personalized outreach sequences using templates, variables, and AI-generated follow-ups
  • Multi-channel syncs. Connect Gmail or Outlook and sync WhatsApp messages directly into the CRM
  • Data enrichment and AI fields. Automatically enrich contacts with external data and generate “magic fields” for quick insights
  • Dashboards. Available on Premium and above to help visualize team outreach performance.

For SMBs, Capsule covers a broader range of business needs, from sales pipelines through to project delivery and marketing, without requiring extra setup.

Folk shines when a team’s main priority is outbound prospecting, with tools like sequences and enrichment designed to boost outreach efficiency. However, the lack of project management features or a dedicated mobile app may put off some users.

Which CRM connects best with your existing software?

A CRM is one of the most valuable tools you can use in your business, but you can only really enjoy the benefits when it connects with your other software. Whether it’s email, accounting, marketing, or any other kind of software you use regularly, integrations save time and reduce the chance of errors.

Capsule integrates smoothly with the tools most small businesses already rely on. Its App Marketplace lets you connect with over 70 popular apps, including:

Transpond’s email marketing integration is particularly valuable, with all your information shared seamlessly between your CRM and your marketing campaigns. You can confidently run advanced email campaigns, manage sign-up forms, and build automations, knowing you’re using the very latest contact details.

If you need something more specific, Capsule connects to thousands of apps through Zapier and Make, or you can build custom integrations with its API.

Folk also offers several integrations. It connects directly to Gmail and Outlook for email sync, and higher plans add WhatsApp sync so conversations can flow into your contact timelines.

Folk’s Chrome extension (FolkX) is a handy way to capture leads from LinkedIn and other sites, and it offers enrichment integrations to automatically add more context to your contacts. For broader connectivity, Folk also supports Zapier, Make, and its own API.

For SMBs, Capsule’s integration ecosystem is wider and more practical, covering finance, productivity, support, and marketing in one place. Folk’s integrations are strongest for sales outreach and enrichment, particularly if your team is already set up for multi-channel prospecting.

Which CRM is easiest to use?

When choosing a CRM, user-friendliness is critical. After all, even the most advanced features won’t do your business any good if they’re too complex to use. A CRM that feels intuitive and easy to set up will be adopted faster and deliver value sooner.

Capsule is designed with simplicity front and center. Its clean, uncluttered interface means even non-technical users can get up and running quickly. Whether you’re starting from a spreadsheet or migrating from another CRM, Capsule makes it simple with options including CSV imports and a one-click migration tool via Import2.


“What I like best about Capsule CRM is its simplicity and ease of use, which makes it accessible to users of all technical skill levels. The user interface is clean and intuitive, allowing you to get started quickly without a steep learning curve or the need for extensive training.”

Matt C.

G2 review

Folk also has a modern, user-friendly interface, and signing up is quick. However, while the interface itself is easy to use, its features work best when processes are clearly defined upfront. For example, setting up structured outreach sequences and workflows requires teams to plan their approach. As a result, Folk could feel more complex to implement for small businesses without an established sales playbook.

Both CRMs are user-friendly in their own ways, but for SMBs looking for fast time-to-value, Capsule’s ease of setup, smooth import options, and accessible mobile app make it the quicker, lower-risk choice.

Which CRM offers more customization and flexibility?

Every business works a little differently, so your CRM should be flexible enough to adapt to your workflows rather than forcing you to change the way you sell.

Capsule strikes a strong balance between simplicity and adaptability. Custom Fields, Tags, and DataTags let you track the client and company information that matters most to your business. You can then create multiple customizable sales pipelines to reflect your different sales processes.

These features let you shape Capsule around your business without all the admin and headaches that come with more complex CRMs.

Folk offers a different model of customization. Its group-based structure allows you to create distinct groups (for example, clients, investors, or partners), each with its own custom fields and views. You can switch between table view and pipeline view depending on what makes sense for the group.

While Folk’s customization options are powerful for teams running structured outreach strategies, they can feel more complex to set up and maintain. Capsule, by contrast, makes customization accessible to any small business, giving you enough flexibility without it getting complicated.

Which platform is best for support and security?

No matter which CRM you choose, reliable support and strong security are essential. You need to know your data is safe and that help is available whenever you need it.

With Capsule, all users get access to 24/7 AI support alongside world-class human support and an extensive online help center. Capsule’s customers consistently praise the support team for being friendly, knowledgeable, and helpful. On the Ultimate plan, you’ll also receive priority support, a dedicated account manager, and personalized training to help your team get the most from the system.

On the security side, Capsule delivers enterprise-grade safeguards, including SOC 2 Type II certification, encrypted data (in transit and at rest), role-based permissions and secure data storage. The company also complies with GDPR, so you can be confident that your customers’ data is safe.

Folk is also known for good customer support, with priority access available on Premium and Custom plans. Security-wise, Folk is currently SOC 2 Type I certified and GDPR-compliant, with data protection measures that meet industry standards.

Both CRMs take support and security seriously, but Capsule goes that bit further with its SOC 2 Type II certification. For small businesses, that combination of reassurance and responsiveness makes it a particularly dependable choice.

Which marketing platform is better for your business?

Capsule and Folk both deliver useful features, but they’re designed with different audiences in mind.

Folk’s strengths lie in helping sales and agency teams enrich their customer data and run structured, outbound campaigns. If your team already has a clear playbook for outreach and the resources to set up your processes, Folk could be a strong fit.

Capsule, on the other hand, is built for small to medium-sized businesses that need a CRM to cover all the essentials, without unnecessary complexity or costs.

From customized Sales Pipelines and Project Boards to Workflow Automations and Dashboards, Capsule provides a complete CRM experience that works straight out of the box. Customers especially value its intuitive design, responsive support team, and powerful mobile app.

If you’re looking for a CRM that helps your business build stronger customer relationships while keeping things simple, Capsule is the clear choice.

Try any Capsule plan free for 14 days or sign up for our free plan to get started with a simple yet powerful CRM.

The SMB Guide to White Glove Customer Service

Software Stack Editor · September 11, 2025 ·

White glove customer service doesn’t belong only to enterprises with big budgets and large teams. SMBs can deliver it too.

Small but thoughtful touches like proactive support and personalized care make every buyer feel valued. The impact is just as powerful: stronger loyalty and higher sales.

In this post, you’ll learn five practical steps to build your white glove service strategy, along with inspiring examples.

Key takeaways for white glove customer service

  • White glove customer service means delivering attentive, tailored and seamless experiences beyond the basics.

  • While effective white glove service builds loyalty, renewals and referrals, it requires consistency and attention to detail to be successful.

  • Data and a robust customer relationship management (CRM) system are at the core of successful white glove tactics, making high-touch service scalable for SMBs.

  • Pipedrive centralizes client data, automates reminders and streamlines handoffs to make every customer feel valued with less effort – try it free for 14 days.

What is white glove customer service?

White glove customer service focuses on offering high-level assistance to buyers and creating premium experiences.

These caring acts demonstrate that you’re willing to go the extra mile to make customers feel special.

Your SMB may not have the budget for luxury loyalty programs or large customer support teams. However, you’ll win by being faster and more attentive than bigger competitors.

For example, an accountancy platform may notice a client’s tax filing deadline is approaching. The team builds trust and long-term customer retention by:

As customer expectations grow, exceptional service like this becomes the baseline.

In fact, Five9 research suggests that 77% of consumers only buy from brands that offer proactive support and 79% expect them to anticipate their needs.

According to the same study, almost 40% of consumers say one negative interaction is enough to make them never buy from that brand again. The stakes are high.

At its core, the white glove approach rests on three pillars:

  1. Proactive communication. Anticipating customer needs instead of waiting for them to reach out. For example, sending a follow-up email before a subscription deadline or checking in after a purchase.

  2. Personalization. Treating each customer as an individual (not just a ticket number) by remembering and referring to past purchases, preferences or unique goals.

  3. Seamless handoffs. Customers who move between sales, onboarding and support don’t have to repeat themselves or start from scratch.

You need a single place to track buyer information and automate key touchpoints to implement these pillars successfully.

Recommended reading

https://www-cms.pipedriveassets.com/Delight-the-Customer.jpg

10 reliable ways to delight the customer and amplify customer loyalty

5 steps to create a white glove customer experience using Pipedrive

Using a customer relationship management (CRM) platform like Pipedrive allows you to log interactions with customers, automate reminders for proactive check-ins and keep customer history in one place.

A data-driven system makes it much easier to stay organized and deliver a premium service-level customer experience without adding extra staff.

Here’s how to offer white glove customer support as an SMB with limited resources.

1. Build a single source of truth for customer data

Build a single source of truth for customer data to eliminate silos and ensure consistent, personalized service across every touchpoint.

Instead of scattered emails and spreadsheets, your contacts, conversations, purchases and preferences all live in one system that your team can access.

The result is faster, more coordinated service that makes every customer feel prioritized.

For example, at a boutique marketing agency with five employees, a client might email her project leader about updating her campaign and later mention a redesign to the business owner.

By logging everything in your sales CRM, the account manager’s following conversation could feel like a thoughtful and tailored solution:

“We saw you were thinking about a redesign. Here’s how we could bundle that with your campaign updates.”

Here’s how to create that single source of truth:

  • Centralize customer feedback and interactions (e.g., emails, calls and notes) in your CRM system

  • Make sure relevant team members have access to the same record, so nothing gets siloed

  • Keep records updated to ensure you’re working from accurate information

How to use Pipedrive as a single source of truth

Pipedrive’s contacts timeline lets you see customer interactions at a glance:

White glove customer service Pipedrive contacts timeline

This view highlights gaps or patterns in your customer engagement, so you’ll see if you haven’t contacted someone or if follow-ups are pending.

Adding custom fields in your pipeline also allows you to track relevant details.

With this information, you can personalize outreach, send timely reminders and tailor your offers to create exceptional experiences.

Say a subscription is about to renew. You could reach out with a custom recommendation based on that customer’s usage, share tips for maximizing value or even flag features they haven’t explored yet to show attention, care and expertise.

Recommended reading

https://www-cms.pipedriveassets.com/Database-management-systems-benefits-and-features.jpg

Database management systems: benefits and top features

2. Personalize touchpoints to build trust and brand loyalty

Personalizing customer interactions based on history, preferences and goals shows buyers you’re paying attention and anticipating needs.

While SMBs may not have massive marketing budgets, personalized experiences make each customer feel like a priority. According to McKinsey research, it’s enough to drive loyalty and sales.

Imagine you want to check in with clients who have recently completed a project with your graphic designers.

Instead of sending the same generic email to everyone, you reach out with personalized insights like:

  • Suggestions for next best steps

  • Tips to get the most from their new designs

  • Recommendations for complementary services

This customized, attentive outreach shows you’re paying attention to clients’ goals and care about their success.

How to use Pipedrive for personalization

Segment your clients to create groups based on project type, engagement level or upcoming deadlines using filters in Pipedrive.

By scheduling activity reminders to follow up at the right time (e.g., calling a week after launch), you’ll show clients you’re paying in-depth attention to their journey.

When you’re ready to reach out, use Campaigns by Pipedrive to create personalized emails for each segment:

White glove customer service Pipedrive Campaigns

Tailoring content to each person’s needs and behavior ensures a premium experience and keeps communication relevant and helpful.

As Laury (an account manager at digital marketing platform DashThis) says about Pipedrive:

Being able to efficiently adapt our service to each individual client not only impacts the quality of our customer service on a daily basis, but ultimately, our churn rate and conversion rate

By combining segmentation, reminders and targeted campaigns, you’ll deliver thoughtful, timely interactions that always feel personal.

Recommended reading

https://www-cms.pipedriveassets.com/Customer-Experience-Transformation.png

A customer experience transformation roadmap for SMBs

3. Automate proactive communication that customers expect

Proactive communication – reaching out before customers need to ask or follow up – shows attentiveness and prevents minor issues from becoming friction.

As a small business, staying one step ahead can be a competitive advantage. Automation helps you manage your customer service, ensuring no client slips through the cracks while freeing your team to focus on high-value interactions.

Pre-emptive messages like reminders, check-ins or helpful tips create a seamless white glove experience that customers notice.

Say a client uses your accounting software to manage payroll and send invoices. Instead of waiting for them to ask about upcoming deadlines or missing reports, you send a:

  • Heads-up before payroll submission

  • Note when tax documents are due

  • Follow-up after a quarterly review

These types of accounting workflow automation help them feel supported and confident.

How to automate communication using Pipedrive

Set sales activity reminder emails for key dates (e.g., payroll runs, tax filing deadlines or invoice follow-ups) so you always reach out at the right time.

Here’s where these live in the Pipedrive platform:

White glove customer service Pipedrive activity reminders

Workflow automations notify team members when they need to take action, ensuring smooth internal handoffs and timely client communication.

Here’s where you view all the sales task automations your team creates:

White glove customer service Pipedrive workflow automations

You can also create automated emails triggered by milestones, such as end-of-quarter summaries or alerts for overdue documents.

Pipedrive in action: Eye Hospital Denmark uses Pipedrive’s automated reminders to order the right lenses for treatments, resulting in a 0% failure rate for this crucial task that keeps patient satisfaction high.

If clients never have to chase you or worry about missing something important, they’ll remember and appreciate you for it.

Anticipating needs and guiding them through the steps with proactive care makes the overall experience feel “white glove”.

Recommended reading

https://www-cms.pipedriveassets.com/How-to-improve-the-B2B-client-experience-for-SMBs.png

How SMBs can enhance the B2B client experience in 6 steps

4. Ensure seamless handoffs by aligning teams

Seamlessly moving customers between colleagues or departments (like sales to onboarding) makes them feel supported and cared for.

When buyers don’t have to repeat themselves or re-explain their needs, it’s a hallmark of professionalism that people remember.

In a smaller business, the same client might talk to:

Clean transitions show your team is organized, aligned and truly listening.

Imagine you run a growing HR software company. A prospect signs up with your sales manager, sharing that their biggest priority is simplifying onboarding for new hires.

If you capture that information in your CRM, the success leader now opens with:

“We know new hire onboarding is a big focus for you. Let’s walk through how to make that easier with our platform”.

How to use Pipedrive to align your teams

Here’s how to ensure seamless handoffs using Pipedrive:

  • Use shared pipelines so marketing and support teams can see where the customer is in their journey

  • Log notes and goals during sales conversations so customer success can pick up without missing a beat

  • Assign activities to the right team member as soon as a sales deal closes, so the buyer knows you care post-sale

  • Set workflow automations to notify the next owner when it’s time to take over, making the next steps effortless

For example, here’s where you’d add customer service notes in Pipedrive:

White glove customer service Pipedrive notes

By aligning your team internally, you make the customer journey smooth and cohesive.

Clients feel like they’re working with one attentive partner and you create consistency that transforms handoffs into white-glove service quality.

Download Your Sales and Marketing Strategy Guide

Grow your business with our step-by-step guide (and template) for a combined sales and marketing strategy.

5. Prove the value of your white glove customer service approach by tracking metrics

By tracking tangible outcomes like renewals, upsells and referrals, you can prove that your white glove customer service strategy drives real return on investment (ROI).

Say your small team invests time in delivering high-touch customer care. Demonstrating its payoff keeps them motivated and justifies the approach as you grow.

Clear, real-time metrics also help you identify what’s working and where to improve:

  • Renewal rate. How well your service builds long-term customer loyalty.

  • Upsell and cross-sell revenue. Whether proactive, personalized support leads to deeper client relationships.

  • Referral count. If customers are satisfied enough to recommend you to others.

  • Time-to-resolution. How efficiently your team solves customer needs (and how smooth transitions are).

  • Customer lifetime value (CLV). The overall ROI of your white glove approach.

Note: While Net Promoter Score (NPS) is often a popular suggestion, only 40.7% of contact centers rate it as “very important” anymore – likely because it’s too broad to capture real-time service performance insights.

For example, an IT services company has invested more time in proactive check-ins and personalized training programs.

At first, it feels like extra effort, but then the numbers show that renewals are up, referrals have doubled and clients are buying add-on services more often.

This data motivates the team to go above and beyond to keep creating these premium experiences.

How to track white glove service effectiveness using Pipedrive

Use Pipedrive’s dashboards and reports to track key service metrics over time:

White glove customer service Pipedrive sales reports

By reviewing insights about upsell revenue or average deal value, your team can see the direct link between high-end service and measurable results.

Create sales reports manually or using natural language prompts. Simply type what you need or choose a pre-written version within Pipedrive’s AI report generator feature:

White glove customer service Pipedrive AI reports

By measuring its impact, white glove customer service becomes a proven growth driver.

Use the insights to keep your team committed and show customers you’re serious about delivering this level of care at every step.

Recommended reading

https://www-cms.pipedriveassets.com/Customer-Service-Report.png

What are customer service reports? Key metrics explained

6 B2B examples of white glove customer service to inspire yours

In business-to-business (B2B), white glove service doesn’t always mean luxury perks or add-ons.

It involves removing friction, anticipating needs and showing customers you understand their business goals as well as they do.

Consider two design agencies. One of them hands a new client a login and says, “Let us know if you need help”. The other sets up a kickoff call, sends a tailored onboarding guide and checks in weekly to track progress.

The work might be the same, but the level of service feels completely different.

Here are six white glove service examples from B2B companies doing it right:

B2B company

How it offers white glove customer service

Shopify

When new merchants sign up for its e-commerce platform, Shopify provides a step-by-step onboarding flow, suggests apps based on the business type and highlights common setup pitfalls.

Takeaway for SMBs: Look at where your customers get stuck in onboarding and offer guidance to help them succeed faster.

Square

Square walks customers through full payment setup, from connecting their bank account to configuring point-of-sale hardware and integrations.

Takeaway for SMBs: Proactively tackle any trickier parts of your process so customers don’t have to figure it out alone.

Monzo

Monzo lets customers preview upcoming access upgrades and prototype features in “Monzo Labs” to give feedback and shape them.

Takeaway for SMBs: Involve customers in the future of your business so they’re more likely to become advocates.

Xero

Xero pairs new clients with account managers who understand their business type and goals. Managers provide tailored advice on workflow optimization, reports and best practices.

Takeaway for SMBs: Personalize your ongoing support so customers feel you care about their situations and targets.

Canva

Canva provides live onboarding sessions, team-specific tutorials and pre-built custom industry templates to get everyone productive quickly.

Takeaway for SMBs: Make sure every end-user gets the tools and knowledge they need to succeed.

Zapier

Zapier’s support reps help customers design automation workflows that solve specific business problems.

Takeaway for SMBs: Show customers how to get the most value from what you sell, even if it means going beyond baseline service.

These examples prove that delivering white glove service doesn’t require a huge team or an enterprise-sized budget.

It comes down to thinking about what customers need at every journey stage and how you can provide it before they have to ask.

White glove customer service FAQs

  • “White glove” involves delivering highly personalized, proactive and seamless experiences.

    White glove customer service’s meaning is similar.

    Retailers and service providers offer anticipatory problem-solving, remove friction and make customers feel valued at every step.

  • For white glove delivery services, omnichannel ensures customers get the same high-touch experience across email, phone, live chat or social media.

  • White glove customer service helps SMBs stand out by offering a more personal, attentive touch.

    Benefits include:

    • Stronger customer satisfaction and loyalty

    • Higher renewal and retention rates

    • More referrals through word-of-mouth and opportunities for upsells

Final thoughts

For SMBs, white glove customer service is a powerful way to stand out against larger competitors. Anticipating needs, personalizing touchpoints and keeping handoffs smooth help build stronger relationships that translate into revenue.

With the right CRM, smaller teams can deliver customer-centric experiences consistently, without adding extra strain.

Try Pipedrive fee for 14 days to centralize client data, automate workflows and ensure that every buyer feels valued at each journey stage.

How HTML, CSS, and JavaScript work together in web design

Software Stack Editor · September 11, 2025 ·

Do you need to learn HTML, CSS, and JavaScript in web design when you can easily create websites with AI-powered tools? That’s a question that stopped me in the tracks because there’s no easy answer.

Download Now: 25 HTML & CSS Hacks [Free Guide]

Still, for someone whose first taste of web design was with Macromedia Dreamweaver, I’ll say it helps to know how websites are put together.

Even if you’re creating landing pages with advanced tools like HubSpot’s AI website generator, you never know when you’ll need to manually change the font, layout, or animate a particular web element. And knowing the web fundamentals — specifically HTML, CSS, and JavaScript — definitely helps.

In this guide, I’ll walk you through each of them, explaining how each web technology works and why it’s important for developing modern websites.

Table of Contents

  • HTML, CSS, and JavaScript at a Glance
  • What is HTML?
  • What is CSS?
  • What is JavaScript?
  • How to Use HTML, CSS, and JavaScript Together for Web Design

HTML, CSS, and JavaScript at a Glance

Almost every modern website uses HTML, CSS, and JavaScript. The fact that you’re able to read this blog, presented in an aesthetically pleasing layout, and see a slide-in pop-up after scrolling to a certain depth is due to all three web technologies.

The best way to understand each of them is to use the house analogy.

  • HTML provides structure to a website, just like how beams and pillars support a house.
  • CSS beautifies an otherwise plain web page, much like paints and wallpapers enhance the beauty of a house.
  • JavaScript allows users to interact with a website by adding behind-the-scenes functionality. It’s like adding plumbing, electricity, and internet to a house.

If you’re not familiar with coding, they might look similar and confusing. But when you’re trained to look into the details, or specifically the syntax and semantics of each, you’ll be able to differentiate them.

What is HTML?

HTML stands for HyperText Markup Language. It structures a web page into logical parts so the web browser knows where the header, body, paragraphs, tables, images, and other elements are. For example, these are common elements that you can specifically state in an HTML document.

  • contains metadata of the web page.
  • consists of visible content that users can see.

  • the heading with the largest font size.

  • starts a paragraph.

  • bolds the text.

How does HTML work?

When you visit a webpage, the browser loads the associated HTML document from the web server. An HTML document organizes web content with a series of HTML tags. Then, the browser creates a Document Object Model (DOM), which it uses to understand how various web elements relate to each other. You can think of DOM as a building blueprint that explains a house’s structure.

Although HTML is not a programming language, I appreciate how it categorizes web elements with standard conventions. For example, if you want to underline a sentence, you mark it with and .

This is underlined text using the HTML u tag.

Just like how an architect uses a blueprint to construct a house, a web browser uses the HTML file to render the web content’s structure. Whether a text is a heading, paragraph, or belongs to a numbered list, it’s all clearly stated in the HTML file.

Here’s what the HTML structure looks like for a simple dialog box.

Hello World

Basic HTML content

You can copy the markup above, paste it into a text editor, and save it as an .html file. Then, open it in a browser and you’ll see a simple, plain web page like this. While you won’t see the HTML markup on the browser, they’re helpful for the browser to map information in ways the web designer intended.

plain html demo, html css javascript in web design

Another important feature of HTML is that you can add attributes to the HTML elements. For example, if you want to turn a text into a hyperlink, you can add an attribute that describes the destination page.

Content

Here, href contains the destination file that you will be directed to when you click Content, which is the anchor text.

Understanding HTML5 in Modern Web Development

The first version of HTML was invented in 1991. Since then, HTML has gone through several major revisions. Today, many modern websites use HTML5, which is more flexible and supports features that modern web development needs.

For example, HTML5 provides semantic tags that better describe specific web elements. Let’s take the , which you’ll find in HTML. Basically, it tells the browser to render a particular text bold. While is still available in HTML5, you can achieve the results with . When you use , you’re also telling the browser the text is significantly important, which is helpful for assistive technologies.

HTML5 also provides better support for audio and video embedding. Remember the days when you had to download Flash to render videos on websites? With HTML5, you can embed videos with tags like and.

For more on the many features that HTML5 offers, read this article.

What is CSS?

Cascading Style Sheets (CSS) is a rule-based language that lets you create an aesthetically pleasing webpage. You can change how every web element looks by applying CSS to override the browser’s default style. For example, if you want a different font, background colors, or margin size, you can write CSS code for the HTML document you created.

How does CSS work?

CSS follows a standardized syntax, which, in my opinion, even for non-coders, is easy to follow. Basically, you write CSS code by specifying the selector and declaration.

  • Selector is the web element you want to modify. For example, a heading can be a selector.
  • A declaration is the new properties that you want to assign to the web element. You use a { } pair to list the declaration, which consists of a property-value pair.

Let’s take the CSS code below as an example.

css style, html css javascript in web design

I’ve added several changes that override the original element’s style, including the background color, text color, and the padding. And here’s what the dialog box looks like with the CSS code.

css html demo, html css javascript in web design

Prettier, isn’t it?

But that’s not all. You can style web elements at different levels by placing the CSS code in different parts of your website.

  • Inline: Write the CSS code within the HTML element using the attribute to limit the changes to one specific web element.
  • Local: Place the CSS within the HTML file, usually in the header, to apply style changes for the entire web page.
  • Global: Create a separate CSS file and link to it from your website’s header to enable global changes for the entire website.

For example, I can use a different font, color, and margin for landing pages by using local CSS without changing the default style for blog articles.

Responsive Web Design With CSS

CSS isn’t only for giving your website a beautiful facelift. It’s also important for enabling responsive design. CSS allows the browser to automatically adjust web elements, including font size, layout, and margin, according to the screen size.

I remember the days when smartphones were introduced. Back then, many websites looked awkward on small screens because responsive design was still in its infancy. These days, the browser can apply different styles based on the device you’re using in a method called CSS media queries. Essentially, CSS media queries define distinct sets of attributes for various screen sizes, including desktop, tablet, and mobile devices.

Another CSS technique that gives you flexibility is to use relative instead of absolute scale when declaring properties.

For example, instead of stating width: 200 px, I use width:70% so the browser can adjust the web element’s width accordingly. Besides %, you can also use relative units like em, rem, and vw with CSS to create responsive web layouts.

What is JavaScript?

JavaScript is a programming language that web developers use to add functions, animation, and integration into websites. It turns a plain, read-only web page into one that users can interact with. For example, it allows you to drag and drop files into a placeholder and view the upload progress in real time.

Since JavaScript was introduced, it has become a core technology that makes a website “livelier.” The automatic scrolling carousel, perfectly-timed pop-in dialogs, built-in rate calculator functions — basically anything that isn’t static is powered mostly by JavaScript.

That said, JavaScript is more than animating objects in modern web development. It’s also a critical technology that performs many intelligent backend services. For example, websites use JavaScript to send customer information submitted in a form to the backend server, which is later stored in a database.

How does JavaScript work?

JavaScript, like many programming languages, has its own rules and syntax. If you share a similar background with me in object-oriented languages like C#, Java, or Python, JavaScript will look familiar.

Initially, JavaScript was a client-side scripting language, which means it supports developing user-facing websites. These days, developers use JavaScript for both client and backend development. When you use JavaScript for client-side functions, the browser retrieves the JavaScript file from the server and runs the code in real time.

Let’s revisit the same example I used to explain HTML and CSS. If you click the button on your webpage, nothing happens. The reason is that there isn’t a “code” assigned to the button. With JavaScript, you can add a function to the button.

For example, what happens if I add the following JavaScript code to the button?

javascript function, html css javascript in web design

The result? You will see the button’s text changed to Clicked! and the dialog’s orientation shifted after you click it.

javascript function demo, html css javascript in web design

While JavaScript used to be associated with animating web objects, its role has significantly evolved. Now, JavaScript can also run backend functions. For example, you can create a function that automatically refreshes marketing analytics in real time from your CRM database. (I won’t be showing the entire example here because it takes more than a few lines of script to do that. Also, it’s better to use HubSpot Marketing Analytics if that’s what you want to do!)

Like CSS, you can include JavaScript inline, locally, or create a separate file.

Pro tip: Download my example HTML file here, which contains the CSS and JavaScript implementations. However, in actual projects, it’s better to store HTML, CSS, and JavaScript separately. Spending 10 years in application development taught me not to mix the user interface and the underlying function code together.

JavaScript and API Integration

An application programming interface (API) is a method that allows multiple software components, including web services, to reliably exchange data. Developers use an API to expose functions to the public, so you don’t have to build them from scratch. Instead, you call the API from your website to access those services.

Because JavaScript is popular for web design, you can use the script to access many APIs. And this includes browser APIs and third-party APIs.

  • Browser APIs are services that are built onto the web browser itself. For example, you can access geolocation data, control audio volume, and capture images from your camera with browser APIs.
  • Third-party APIs let you integrate external functions into your website. For example, you can stream live video to Facebook, access HubSpot CRM data, and use Google Maps with the APIs that these platforms provide.

Let’s check out the JavaScript below. It creates a Google Maps object with the google.maps.Map() constructor. A constructor is code that creates a new object that mimics the original blueprint. In this case, it creates the Google Map object.

javascript api, html css javascript in web design

Then, you can use API constructors like google.maps.Geocoder(), google.maps.Marker() and google.maps.InfoWindow() by including them in your JavaScript code.

Below is how I use the google.maps.Marker() API to mark a position on the map.

javascript google maps marker, html css javascript in web design

How to Use HTML, CSS, and JavaScript Together for Web Design

So far, I’ve clarified the roles of each scripting and programming language. The question now lies in combining them together so that you have a beautiful, functional website with an organized codebase.

If you’re using web development tools like HubSpot’s website builder, you don’t need to worry about unifying, organizing, and maintaining the files. The tool does the heavy lifting so you can focus on creating a website your customers love.

However, if you decide to build your sites manually, you’ll need to create separate HTML, CSS, and JavaScript files.

Typically, the project folder of a single-page website looks like this.

  • Project
  • Index.html
  • Style.css
  • Script.js

To include the CSS file, place the following line in the of the webpage.

Meanwhile, for JavaScript, include the following line of code in the tag:

<script src="script.js“>

Depending on the use cases, you can also place the JavaScript in the , but for performance, I’d suggest using the async or defer attribute.

<script src="script.js” defer >

Pro tip: When building websites, I can be quite obsessive in keeping code maintainable, readable, and reusable. That’s why I don’t put all the HTML, CSS, and JavaScript code in a single file.

Design with HTML, CSS, and JavaScript.

Now, you’ve learned the basics of HTML, CSS, and JavaScript. They’re core technologies that drive modern websites. And they do more than create beautiful sites – they also enable complex functions that enhance everything from website interactions to business transactions.

To master HTML, CSS, and JavaScript in web design, you’ll need to invest time, resources, and effort. But even with basic knowledge, you can still do wonders in your web design, provided that you’re using web development tools that bring them together.

Unfortunately, we don’t render other fonts on the blog, so if you can make commands or tags in bold, that works fine!

Editor’s note: This post was originally published in November 2018 and has been updated for comprehensiveness.

How to blend web analytics and digital marketing analytics to grow better

Software Stack Editor · September 11, 2025 ·

When I started in content marketing in 2013, my digital marketing analytics strategy was refreshing Google Analytics to check if page views were up. Traffic climbing meant we were winning; traffic dropping meant panic mode.

→ Download Now: The Beginner's Guide to Email Marketing [Free Ebook]

Over many B2B SaaS roles, I learned that tracking traffic alone can‘t answer the question every exec asks: “Is our marketing actually working?” I’ve sat in countless meetings where no one had a clear answer.

Most teams are stuck in the “more traffic is better” mindset, but traffic only tells part of the story. If you want to know what’s really driving results, you need to go beyond the basics.

In this post, I’ll share the digital marketing analytics I rely on to make smarter decisions, prove impact, and confidently answer that executive question. Bookmark this guide and jump to what you need most.

Table of Contents

  • What are digital marketing analytics?
  • Digital Marketing Analytics vs. Web Analytics 
  • What is a digital marketing analysis?
  • How to Use Digital Marketing Analytics Effectively
  • Digital Advertising Analytics

Digital marketing analytics help you make sense of what your audience is doing online — and whether those actions are helping your business grow.

I think of digital analytics as the thing that helps me read between the lines. It’s one thing to know someone clicked or filled out a form — but I want to know what that tells me about what’s working.

Web analytics mostly stick to site-level metrics — page views, bounce rates, and session times. But digital marketing analytics go further. They pull data from across your channels — email, ads, social — and help you understand how your overall marketing is performing and where it’s driving genuine results.

Digital Marketing Metrics to Know

Early on, I was glued to page views and social impressions. They looked great in a report — but didn’t tell me if we were bringing in leads, closing deals, or growing the business.

We were pulling in traffic and checking all the usual boxes — but none of it was turning into leads. At some point, I stopped trying to make the reports look good and started asking: is any of this actually working? That’s when I began focusing on metrics that showed real impact, not just movement.

illustration of a simple stick figure character looking at their reflection in a mirror, where they appear as a superhero with a cape

Source

Below are the metrics I’ve found most valuable across different areas of digital marketing — starting with the basics.

Best Metrics for Website Marketing Analytics

These are the site-level metrics I track most often to understand how content and UX are performing:

Visitor

I focus on unique visitors because it shows me how many individual people are coming to the site — not just refreshes or repeat views. When I’m checking content performance, this is one of the first things I look at.

Page View

Every page load counts as a page view. It’s not the most insightful metric on its own, but it helps spot trends and identify content that’s getting attention.

Session

A session includes everything a person does on your site in one visit — clicking around, reading multiple pages, maybe filling out a form. It ends after 30 minutes of inactivity. I use sessions to get a sense of how deep someone’s engagement goes beyond a single page view.

Traffic

I rarely look at traffic in isolation. I track it over time and in context with other metrics — especially conversion rate — to understand if the traffic we’re getting is valuable.

Traffic by Channel

This shows where your visitors are coming from — search, social, email, direct, etc. I use it constantly to figure out which channels are performing well and where we need to shift focus.

Traffic by Device

This tells me whether people are browsing on mobile, desktop, or tablet. I always check this when optimizing content layout or troubleshooting drop-offs — especially if conversion rates are low on one device type.

Ratio of New Traffic to Returning Traffic

This metric compares first-time visitors to people who‘ve been to your site before, shown as percentages. I love this metric because it shows whether you’re growing your audience (new traffic) while keeping existing visitors engaged (returning traffic).

Time on Page

This metric helps me figure out if people are sticking around. If the time is high, it usually means the content is useful or engaging. If it’s low, I take that as a sign to revisit the intro, formatting, or value of the page.

Interactions per Visit

I look at how many actions people take on average during a session — clicking CTAs, downloading content, watching videos. It gives me a sense of whether we’re offering enough value or opportunities to engage.

Bounce Rate

I track bounce rate to see how many people leave after viewing just one page. Sometimes a high bounce rate is fine — like if someone finds exactly what they need on a landing page. But when I see unexpected spikes, it usually means there‘s an issue with the content or the page isn’t loading correctly.

Core Web Vitals

These are Google’s signals for user experience — things like load speed, layout shift, and responsiveness. I keep tabs on them not just for SEO reasons, but because no one sticks around for a page that loads like molasses or jumps all over the place.

Scroll Depth

I track how far visitors scroll down our pages to understand content engagement. If people aren‘t scrolling past the fold, I know the opening content needs work or the page design isn’t drawing them in.

Best Metrics for Lead Generation

These are the metrics I use to track my lead generation efforts:

Call-to-Action (CTA) Click-Through Rate

I look at CTA clicks to gauge whether the content is doing its job. It’s a quick gut check: If a post is getting solid traffic but no one’s clicking “Get the Guide,” that tells me something’s not landing — either the content didn’t connect or the offer needs reworking.

Submissions

Submissions count the number of people who complete a form after clicking a CTA. If we have high CTA clicks but low submissions, that usually points to friction — maybe the form is too long, or the offer doesn’t feel worth it.

Conversion Rate

Conversion rate tracks how many people take a desired action (like signing up or downloading something) compared to total visitors. I track this across content types and channels to see what’s converting — not just what’s getting attention.

Cost Per Lead (CPL)

CPL tells me how much we’re spending to generate each lead. I break this down by channel and campaign to figure out which ones are efficient and which ones are draining the budget without results.

Lead Velocity Rate

This measures how quickly leads move through the funnel — from new lead to MQL, or from MQL to customer. If the pace slows down at a particular stage, I know it’s time to revisit our nurturing strategy or look for friction.

Free Trial Conversion Rate

If you’re running a free trial model, this one’s critical. It shows how many people who start a trial become paying customers. I use it to connect top-of-funnel content to actual revenue and flag where prospects might be falling off.

Pop-Up Conversions

Pop-up conversions track how many visitors fill out forms triggered mid-browse. While pop-ups can be annoying, I’ve found that well-timed, relevant ones can move the needle — especially when tied to intent.

Ratio of Generated Leads to Marketing-Qualified Leads (MQL)

This metric compares total leads to those that are actually a good fit. I track this to evaluate the quality of leads we’re bringing in and how well our content aligns with our ideal customer profile.

Leads to Close Ratio

The leads to close ratio shows what percentage of your leads turn into paying customers. It’s one of the clearest ways to gauge content effectiveness — if a certain offer or campaign brings in leads that never close, it’s time to pivot.

Best Metrics for Email Marketing

Email’s been one of the most consistent performers in every role I’ve had. It’s straightforward, flexible, and still delivers when done well. These are the metrics I look at to figure out if an email campaign is doing its job.

Open Rate

This tells me how many people opened an email out of everyone I sent it to. I use it to test subject lines and timing. If open rates dip below our usual baseline, I dig into whether the content felt relevant — or if it even made it to the inbox. For B2B SaaS, I generally aim to hit at least 20%.

Opens by Device

This shows which devices (mobile, desktop, tablet) people are using to read emails. Most folks check email on their phones, so I always make sure our design works well on mobile first.

Click-Through Rate (CTR)

CTR tracks how many people clicked a link inside the email. I’ve seen huge differences here based on personalization and list segmentation. The more targeted the message, the better this number usually looks.

Bounce Rate

Bounce rate tracks how many emails didn’t make it to someone’s inbox. I watch it to catch list issues early. If it spikes, I remove outdated or bad addresses.

Unsubscribe Rate

If more people are leaving than joining, I take it as a sign we’re either sending too often — or just not giving folks a good enough reason to stick around.

List Growth Rate

This metric shows whether our list is trending up or down. If more people are unsubscribing than signing up, I take a closer look at our content or our sending frequency.

Best Metrics for Social Media

Follower counts might look impressive in a slide deck, but they don’t pay the bills. Here are the social media metrics I track to understand whether our efforts are working:

Engagement Rate

I calculate this by taking all the likes, comments, shares, and clicks, then dividing by our total followers. A high engagement rate tells me people aren’t just seeing our content — they care enough to interact with it.

Follows and Subscribes

This metric tracks how many people choose to follow your social accounts because they want to see more of your content. While follower count isn’t everything, I track growth to understand whether our content strategy is attracting the right audience.

Shares

Shares are one of the strongest signals of content value. If someone’s willing to repost something under their name or brand, that means it hit the mark.

Audience Growth Rate

I use this to track how quickly our following grows over time. I calculate it by dividing new followers by total followers, then multiplying by 100. It’s a more honest view than just watching the number tick up.

Post Reach

Post reach tells me how many people saw a piece of content. I track this as a percentage of total followers to get a sense of how well we’re navigating platform algorithms and timing.

Potential Post Reach

This metric estimates how far our content could go based on who shared it and the size of their audiences. I don’t put too much stock in this number alone, but it helps measure brand amplification. Potential reach is typically 2-5% of this total.

Share of Social Voice

This metric compares how often people mention us versus competitors. I track both direct mentions (with @handles) and indirect ones (brand name only) to see how we’re showing up in conversations that matter.

Approval Rate

Likes are the simplest form of validation, but they still matter. I use this metric to track positive reactions across campaigns and make sure our tone is landing as intended.

Best Metrics for Ecommerce

Even if you’re not running a full-on online store, these metrics still matter if you’re selling anything through your website:

Shopping Cart Abandonment Rate

I track how many people add items to their cart but don’t complete the purchase. When this number creeps up, it usually means something’s off — maybe the checkout process is clunky, or the pricing catches people off guard at the last step.

Sales Conversion Rate

This shows me how many site visitors become customers. I also pay attention to micro-conversions — like product page views or add-to-cart actions — to see where people are dropping off or getting more serious about buying.

Email Marketing Opt-in

I track how many people sign up for emails while browsing or checking out, and I break that down by traffic source. It’s an easy way to spot which channels are bringing in subscribers who want to hear from us again.

Customer Acquisition Cost

Customers don‘t always come cheap. I calculate our total marketing spend divided by the number of new customers acquired to understand our actual cost per customer. The higher the number, the more we’re spending and the narrower our profit margins.

Average Order Value

This one’s simple: total revenue divided by number of orders. I use it to see if people are buying more expensive items or adding extras to their cart. Sometimes, just tweaking bundles or offering free shipping thresholds can help bump it up.

Revenue by Source

This metric tells me which marketing channels are driving sales — not just traffic. Social might bring in volume, but if search or email drives more purchases, that’s where I double down.

These metrics cover the most important digital marketing analytics across different channels. Depending on your marketing tools and channels, you might track additional metrics specific to your business.

But why are digital marketing analytics so much more powerful than basic web analytics?

Digital Marketing Analytics vs. Web Analytics

The most significant difference between web analytics and digital marketing analytics comes down to scope.

Web analytics tell you what’s happening on your website — page views, bounce rate, time on page. That’s helpful, but it doesn’t tell you whether those visits are turning into leads or customers.

Digital marketing analytics go further. They help you connect all your marketing efforts — email, social, ads, blog content — and see how they work together to drive results. Instead of just looking at what people do on your site, you get a clearer view of how they found you, what influenced their decisions, and what led to revenue.

I’ve seen teams get stuck optimizing for web metrics that look good on paper, but don’t lead to any business outcomes. I’ve done it myself — spending months trying to improve blog performance based on time on page, only to realize those posts weren’t attracting the right audience or creating meaningful engagement.

If we’d been using digital marketing analytics from the start, we would’ve seen that we hadn’t aligned our content with our goals — or the buyer’s journey.

That’s why I always come back to the marketing and sales flywheel. It’s not just about top-of-funnel traffic. It’s about how everything works together — attracting, engaging, and delighting people at every stage. Digital marketing analytics make it easier to track that cycle and figure out what’s legitimately helping your business grow.

Web analytics gives you the puzzle pieces. Digital marketing analytics help you put them together.

inbound marketing flywheel

Source

A digital marketing analysis is the first step to developing a strong digital marketing analytics strategy. I use this process to structure a business goal into outcomes based on three broad categories:

  1. The relationship between different marketing channels
  2. People-centric data on the buyer’s journey
  3. Revenue attributed to specific marketing efforts

Download our free ebook on inbound marketing analytics — the key metrics your executives really want to see.

Let’s highlight these main differentiators.

1. The Relationship Between Marketing Channels

Digital marketing analytics provides a solid look into the direct relationships between your marketing channels. It‘s great to be able to see how each of your channels (e.g., social media, blogging, email marketing, and SEO) is performing. Still, the true power of analytics comes into play when you can easily tie the effect of multiple channels’ performances together.

For instance, let’s say you sent an email to a segment of your database. Digital marketing analytics not only tells you how many people clicked through from your email to your website, but also how many of those people converted into leads for your business when they got there.

Furthermore, you can compare the impact of that individual email send with other marketing initiatives. Did that email generate more leads than the blog post you published yesterday? Or was the content you shared via Twitter more effective?

2. People-Centric Data on the Buyer’s Journey

As we mentioned earlier, a key differentiator between web analytics and digital marketing analytics is that the latter uses the person — not the page view — as the focal point.

Digital marketing analytics enables you to track how your prospects and leads are interacting with your various marketing initiatives and channels over time. How did the lead first come to find your website? From Google? Facebook? Direct traffic? Is that lead an active part of your email subscriber base, clicking and converting on marketing offers presented via email? Do they read your blog, and have they downloaded any content offers that could indicate an interest in your products/services?

Full-stack digital marketing analytics can tell you all of this and more, providing you with extremely valuable lead intelligence that can help inform the direction of your future campaigns.

Looking at all of this information in aggregate can help you understand trends among your prospects and leads and which marketing activities are valuable at different stages in the buyer’s journey.

Perhaps you find that many customers’ last point of conversion was on a certain ebook or white paper. Having this data makes it possible to implement an effective lead management process, enabling you to score and prioritize your leads and identify which activities contribute to a marketing-qualified lead (MQL) for your business.

3. Revenue Attributed to Specific Marketing Efforts

One of the most valuable functions of marketing analytics is its ability to attribute specific marketing activities to sales revenue. Sure, your blog may be effective in generating leads, but are those leads turning into customers and making your business money? Closed-loop marketing analytics can tell you.

Download our free ebook on closed-loop marketing and take your digital marketing analytics to the next level.

The only requirement here is that your digital marketing analytics system and customer relationship management (CRM) platform are connected.

Having this closed-loop data can help you determine whether your marketing initiatives are contributing to your business’s bottom line. Through it, you can decide which channels are most critical for driving sales.

Perhaps your blog is your most effective channel for generating customers, or conversely, you see that social media is only as powerful as an engagement mechanism, not a source of sales.

You’ll set better, more outcome-driven goals when you measure how your channels work together, track behavior across the buyer’s journey, and connect revenue back to specific marketing efforts.

Now, let’s talk about how to use these marketing analytics effectively.

How to Use Digital Marketing Analytics Effectively

I’ve had campaigns with solid traffic and decent engagement — but nothing to show for it. That’s when I realized surface-level metrics weren’t telling me what I truly needed to know.

I’ve been there. The dashboards look fine, but when someone asks, “Is it working?” — I don’t always have a clear answer.

For me, it usually means one of two things: the goals are fuzzy, or we’re measuring things that don’t matter.

Here’s how I’ve learned to cut through the noise and use analytics to make better, more confident decisions.

Master SMART Marketing with our free, goal-setting Excel template.

S.M.A.R.T. Goals

I’ve spent way too much time staring at dashboards without really knowing what I was supposed to take away from them. Traffic’s up — so what? If I can’t explain what that means for the business, the number doesn’t help me much.

Before diving into data, I try to get specific about what I’m aiming for. “More traffic” isn’t a real goal — something like “grow organic visits from X pages by 20%” gives me a direction and something I can check back on.

I use the S.M.A.R.T. framework to shape goals that are actually useful:

  • Specific – Instead of “get more traffic,” I’ll set a goal like “increase organic traffic from our target keyword group by 25%.”
  • Measurable – If I can’t put a number on it, I won’t know if I’m making progress. I always establish a baseline first.
  • Attainable – I try to stretch, but not to the point of setting myself up to fail. Past performance helps me stay realistic.
  • Relevant – I tie every goal to a bigger outcome — whether it’s generating pipeline, improving retention, or increasing revenue.
  • Timely – Every goal gets a deadline. Otherwise, it’s just a wish list.

A good goal gives me something to measure, something to optimize toward, and something to share when someone asks, “How’s that campaign going?”

In my experience, most marketing goals fall into one of three buckets:

  • Traffic growth and channel diversity – Bringing in consistent visitors from multiple sources
  • Lead generation – Turning that traffic into real prospects
  • Revenue attribution – Tracking which marketing efforts contribute to actual sales

Getting to those insights isn’t always easy. Most teams — mine included — are pulling data from five or six different platforms: email metrics from one tool, social stats from another, blog performance from the CMS, and so on.

When everything’s scattered across different tools, it’s tough to connect the dots — or figure out where to spend your time.

I’ve found it way easier to get clarity when I use an all-in-one marketing and reporting platform that brings all our reporting together. Instead of bouncing between tools, I can see the full picture and make quicker calls about what’s worth doubling down on — or ditching.

Campaign Reporting

Instead of looking at each traffic source or channel in isolation, I use custom reporting capabilities to build campaign-level views. That way, I can see how a campaign performs across all platforms — not just how one blog post or email did. I want the whole picture, from first touch to final conversion.

HubSpot Marketing Hub reporting dashboard

Source

I’ve used HubSpot’s Marketing Hub to create campaign-level views that combine data from blog posts, emails, CTAs, landing pages, and ads. These reports have helped me spot what’s driving results and what needs adjusting.

Here are a few I rely on most:

Web Traffic by Original Source

I use this to see where visitors are coming from — search, email, social, etc. — and how those sources perform over time. It’s invaluable for spotting which channels are most effective at turning traffic into leads or customers.

For example, I might discover that while social media drives a lot of traffic, search engine traffic converts to leads at three times the rate. That insight completely changes how I approach content distribution strategy.

First Conversion by Original Source/Persona

This report shows me which content offers or CTAs led to someone’s first conversion — and where they came from. I also segment by persona when I can. That helps me understand which audience groups respond to different types of content.

Contacts Funnel Report

This report helps me track how leads progress through the funnel — from contact to MQL, SQL, and eventually customer. If a large percentage of leads are stalling at one stage, it usually means something’s missing — like a nurture email, better content, or a clearer handoff.

Marketing Contribution to Revenue

This report is key to connecting the dots between marketing and closed revenue. I use lifecycle stages to see which leads became customers and their value. If I can tie a blog series or campaign to revenue, that’s the kind of stat leadership pays attention to.

Customer Acquisition Cost

You can track customer acquisition cost in HubSpot using calculated fields or custom properties to show total marketing spend per new customer.

Content marketing often comes with higher upfront costs, but over time, I’ve found it leads to lower acquisition costs compared to paid channels. These closed-loop reports help me track business outcomes — not just vanity metrics. But all the insights in the world don’t mean much unless you use them.

The real value of digital marketing analytics isn’t just proving marketing’s worth to leadership — it’s using those insights to optimize your performance across every part of your system.

With closed-loop reporting, I can also show how marketing supports sales — by delivering leads that are more likely to convert.

Digital Advertising Analytics

I’ve worked with companies that poured serious budget into paid ads — but couldn’t say whether those ads were bringing in qualified leads or just clicks. And I get it. It’s easy to report on impressions or cost-per-click. It’s a lot harder to track what happens after someone clicks.

According to the Gartner 2025 CMO Spend Survey, digital channels now account for 61.1% of total marketing spend, with seven out of 10 sectors investing more than 60% of their budget in online channels.

a bar chart breaking down digital channel investment allocations in paid media, owned, and earned

Source

But surface-level metrics like click-through rate only tell part of the story. You can’t measure actual performance unless you connect ad data to outcomes — leads, customers, revenue.

To avoid that blind spot, I always make sure our ad data connects directly to the CRM.

One thing that surprised me early on was how differently various ad types behave. Paid search and social media ads might drive fast conversions, but display ads are more about visibility and long-term brand awareness. People might not click at all — but later, they’ll search for your brand or come back directly. If you’re only measuring direct clicks, you’re missing the impact.

The biggest shift in my overall digital marketing strategy came when I stopped treating ads as a silo. Now, I look at them as just one part of a larger, integrated marketing system. When I measure them in context — alongside content, email, and everything else — I get a much clearer picture of what’s working and how to spend smarter.

Grow better with digital marketing analytics.

After more than a decade in marketing, I’ve learned that traffic and clicks only tell part of the story.

What I care about now is whether our work is creating momentum — bringing in the right leads, shortening the sales cycle, and supporting the bigger business goals. That’s where digital marketing analytics come in.

I use them to spot what’s working, what’s not, and where to focus next. It’s less about building perfect dashboards and more about having enough clarity to make good decisions and explain them to the team (or your boss).

For me, it starts with clear goals, simple reporting, and metrics that actually tie back to outcomes I care about — like leads, revenue, or customer retention.

And once I can see how our efforts connect across channels, it’s so much easier to plan our next steps.

Editor’s note: This post was originally published in February 2019 and has been updated for comprehensiveness.

Drowning in a Sea of Sameness: How brands can rise above the AI-generated noise

Software Stack Editor · September 10, 2025 ·

There’s a challenge brewing for businesses everywhere.

Content is becoming virtually indistinguishable online, and it all boils down to the latest industry disruptor: AI.

It’s no secret that AI adoption is reaching top speed across many aspects of life and work. Forbes predicts that by the end of this year, 378 million people will be using AI.

While these tools are more accessible than ever, this also defines a growing problem — everyone has access to the same resources. The universal ability to prompt ChatGPT or your favorite LLM for the same output, over and over again.

Unremarkable AI-generated content is flooding our screens as a result, creating a phenomenon known as the Sea of Sameness — a world where inboxes are full of nearly identical emails, all sites are curating the same portable vacuum cleaners or publishing the same pumpkin bread recipes, the hosts of the videos you’re watching are all selected from a preestablished bench of avatars, and all digital ads start to look the same.

To break through the noise, taste and authenticity are everything. Brands that harness their unique value proposition — that X-factor that makes them stand out from the rest — are winning in the AI era.

And they’re using AI to help build the foundation.

Download Now: Free Loop Marketing Prompt Library

Navigating the Sea of Sameness

Business leaders want fast results. Naturally, this makes AI seem like a panacea for idea generation and content production.

You ask a tool like Claude to help you draft an email to appeal to prospective customers, and you get something like the following in seconds:

Input: You’re a marketer at a software company. Create a lead generation email for cold outreach.

Output: Here’s a lead generation email template:

Subject: Quick idea for [Company Name]

Hi [First Name],

I noticed [something specific about their company/role — e.g., “your team has been growing quickly” or “you recently launched a new product”]. That’s exciting!

I work with [type/size of companies, e.g., “small businesses”] to help them [main benefit, e.g., “generate more qualified leads on a limited budget”]. On average, our clients see [insert short, tangible result, e.g., “a 30% lift in inbound demo requests within 3 months”].

Would you be open to a quick 10-minute call next week to see if this might be useful for [Company Name]?

Best,

[Your Name]

[Your Role]

[Your Company]

[LinkedIn link or website]

Speed can be an advantage, but keep in mind that a company on the other side of the globe, or a competitor in your backyard, could use a prompt like this and yield a similar result. Because, as you know, everyone has access to the same tools.

Quality in, quality out. The difference lies in what you feed them.

Churning out content at scale has never been more attainable, but that’s yesterday’s strategy. To navigate the Sea of Sameness, you need to focus on taste, not tactics.

While AI has lowered the barrier to entry for content production, the volume of content available for consumption is at an all-time high. Anyone who scrolls through Instagram knows there’s a constant stream of posts from brands and creators.

Not to mention, customer attention is spread thin. From email to websites. Instagram to YouTube. And even Threads to Lemon8. Your audience is now spending time on platforms that in some cases didn’t exist five, ten years ago. And they’re turning to AI search and forums like Reddit for product discovery.

Traditional marketing tactics, like SEO, aren’t working as well as they used to. Search Engine Land found that 60% of Google searches today end in no clicks.

We’re at the cusp of a generational shift in how people shop for products, and brands need to adapt to a world reshaped by AI. HubSpot calls this new way of acting Loop Marketing — more on that later.

Why Taste Beats Tactics

Driving traffic to your website used to be the easy part. Now, businesses need to adapt to a world where buyers are everywhere except your website, and AI answers questions before they click.

HubSpot research shows that most consumers prefer social media to discover new products, and one in four users bought a product on social media in the past three months.

Plus, 74% of those who have tried generative AI tools have already used them for a shopping-related purpose, such as researching products, pricing, or reviews.

74% of U.S. consumers who have tried generative AI-enabled products have used them for a shopping-related purpose

These shifts in how people discover and evaluate products raise the stakes for businesses. With discovery happening off your site and decisions being shaped by algorithms, the question isn’t just how to get in front of buyers — it’s how to stand out when you do. That’s where taste comes in.

Taste is rooted in understanding how to deliver the right message to the right person at the right moment. It’s human. It’s difficult to imitate. It’s a team effort between defining your unique brand identity and leveraging AI to make the customer go, “Was this message written just for me?

Achieving this requires a thoughtful effort to figure out what differentiates your brand from competitors — and to codify it. The reality? Less than half of businesses have this information documented.

How to Express Your Brand Identity

The starting point for tackling this new AI-driven era of marketing is to Express your unique brand identity — at least according to the Loop Marketing playbook (told you this was coming back around).

Before you tap AI to help you create content, use what you know about your audience, like customer data, to define who you are and how you want customers to perceive you. Then, bring in AI as a brand identity concierge to help you produce content that actually connects with your audience and, most importantly, looks and sounds like you.

This Express stage is measured in efficiency. How well does your business story match how buyers need to experience it? In this stage, it’s the data, context, and point of view you give the AI that gives you a competitive advantage.

It’s worth repeating that because it’s crucial to your success: Only you can give AI the context it needs to tell your story.

That’s the difference between using AI as a shortcut and using it as a true amplifier for your business.

Here’s the breakdown.

1. Define your audience.

The first step in building a strong brand identity is outlining your audience profile. Who are they? What do they care about? Figure out what goals they’re chasing and what obstacles stand in their way.

The more you know about who you’re talking to, the easier it is to create messages and experiences that actually land.

Let AI handle the busy work. Instead of manually combing through customer reviews, call notes, and social chatter, ask your favorite tool — whether that’s Claude, ChatGPT, Gemini, Breeze — to summarize these insights for you. Something like: “Tell me about our most successful customers. What are the biggest pain points that they have expressed in their feedback? Give me the history of our best deals.”

In return, you’ll get a clear customer profile that guides your strategy and ensures your content resonates at every connection point.

2. Craft your style guide.

Knowing who you’re talking to is only part of the equation. You also need to articulate why you’re the right choice for them. That means defining what makes you cooler than the competition.

Drop those details into a simple, shareable style guide that captures your mission, tone, and brand POV. Then, upload that style guide into your AI agent to ensure your brand identity is embedded into every campaign, conversation, and piece of content you create.

3. Generate your concept.

A style guide defines how you show up, but the real power comes from turning those guardrails into a story buyers can rally around.

This is where you build the foundational, customer-driven narrative that defines who you are and why you’re the best option. You can then use that narrative to generate the creative concepts that will carry it into market.

Start by translating your brand story into themes, angles, or key messages that matter most to your customers. Then, use AI to expand on those themes by using prompts like: “Create three campaign concepts with key messages for our target customers,” or “List five content ideas based on our core brand themes.”

In the process, you’re building a bank of audience-informed, story-driven content ideas that your marketing team can pull from and begin riffing off of.

4. Build your content strategy.

A strong narrative is only as good as how it comes to life across formats. You have to deliver it in all the right places, whether that’s YouTube videos, ads, emails, text articles, or social media.

Create a campaign brief that maps your key messages to the channels where your audience spends their time the most. Maybe they’re heavy email users or deep into forums. Then, outline the mix of assets you’ll need to bring it all together. In this case, newsletter content and a Reddit response bank.

Once your assets are created, test and refine them before hitting “send” or pressing the “publish” button. You can use AI to get specific recommendations on what to keep or refine based on the context — customer insights, style guide, and brand narrative — that you provide.

Putting it all together turns raw data into actionable marketing. It’s a repeatable system for reaching the right people with the right story, every time.

The Bottom Line

The Sea of Sameness is rising faster and faster as AI adoption accelerates. But sameness doesn’t have to be inevitable. Instead of drifting along, you can chart your own course, one where every message feels like it was written just for your audience.

That starts with expressing your identity clearly and consistently. It means using AI as a partner to amplify your voice and scale without losing what makes you unique. When you harness AI with intention, you build a foundation that transforms it from a content factory into a true growth engine.

In a world where everyone has access to the same tools, trust, taste, and authenticity become the only competitive advantage.

Best SMB Guide to Customer Intimacy

Software Stack Editor · September 10, 2025 ·

A customer intimacy strategy gives SMBs a powerful edge in crowded markets.

When you understand your audience, you can meet their needs faster and more accurately. You build trust and stronger, lasting relationships.

The result is stronger retention, higher customer lifetime value (CLV) and more referrals.

This guide shows you how to grow sales by getting closer to your customers. It includes real customer intimacy examples and practical tips to shape your strategy.

Key takeaways from customer intimacy

  • Customer intimacy is one of three key market leadership strategies in the Value Disciplines framework.

  • Trust, feedback and strong frontline support turn average customer relationships into more profitable ones.

  • Track customer intimacy success through metrics like retention rates, CLV, NPS scores and upsell revenue – readily available in your sales CRM and marketing tools.

  • Pipedrive helps you scale customer intimacy with personalization, smart data management, easy integrations and workflow automation. Start a free 14-day trial today and get closer to your audience.

What is customer intimacy?

Customer intimacy is a business strategy that builds close relationships with individual buyers to increase sales and retention.

It’s all about tailoring solutions to each customer’s needs to create exceptional value over time – a form of in-depth personalization.

The concept comes from Michael Treacy and Fred Wiersema’s Value Disciplines model.

Published in Harvard Business Review in 1993, this framework shows companies three ways to lead their markets:

  • Operational excellence. Deliver products at competitive prices with minimal hassle. Amazon leads e-commerce this way through low costs, efficiency and reliability.

  • Product leadership. Launch breakthrough products before competitors do. Apple uses this approach with frequent tech innovations that keep customers loyal.

  • Customer intimacy. Provide customized products and services for specific customer needs. Accenture uses this approach by tailoring its consulting through close client partnerships.

Companies can focus on one area for differentiation while maintaining basic performance in the other two.

That basic level is the “threshold value”, the minimum performance needed in secondary areas. Here’s how it works:

Customer intimacy Value Disciplines framework

If you prioritize customer intimacy, you’ll still need efficient operations and reliable products to succeed. You just don’t have to excel in those secondary areas.

Customer intimacy puts buyers at the heart of business decisions. Like customer-centricity, this approach delivers better services and stronger relationships.

Recommended reading

https://www-cms.pipedriveassets.com/Business-development-strategies.png

Understanding business development: definition, roles and strategies

Why customer intimacy works so well for SMBs

Customer intimacy works best for small and medium-sized businesses.

Rather than extensive infrastructure or market research budgets, this approach focuses on relationships and quick responses.

A small retailer can’t match Amazon’s efficiency without massive logistics networks. Even large businesses struggle with this challenge.

However, it can stand out by remembering repeat customers, adjusting products to meet local demand and delivering hyper-personalized content.

Take a look at how pet brand Chewy did it:

Customer intimacy Chewy review on Reddit

Customer intimacy helped fuel Chewy’s early success. News of these personal touches spread quickly online, building brand awareness.

Intimacy is also more achievable for SMBs as they’re naturally closer to audiences.

With fewer customers, you can easily monitor what people value and how they buy. This allows you to adjust your pricing, sales and marketing strategies accordingly.

Recommended reading

https://www-cms.pipedriveassets.com/blog-assets/relationship-selling.png

How to use relationship selling to connect and convert

Building customer intimacy: a simple 5-part strategy

Forget the grand gestures for a minute. Customer intimacy happens through small, consistent actions across every touchpoint.

Here’s how to make customers feel understood and valued.

1. Personalize experiences with CRM and segmentation

Organize your customer data to understand individual preferences and behaviors better.

Use a customer relationship management (CRM) system like Pipedrive to track interactions and purchases. This software will help you keep track of personal details that can inform future engagements.

Here’s a simple workflow to start with:

  • Record personal details customers share with your team – like birthdays, interests, business milestones or family information

  • Segment your customer base by factors like purchase frequency, product preferences or business size

  • Build personalized email campaigns that reference past purchases or suggest relevant new products

  • Train team members to review customer profiles before calls or meetings

Imagine a sales rep opens Pipedrive’s contact detail view before checking in with a hot lead.

In the notes, they see the buyer loves to travel and mentions recent trips in most calls. It provides instant common ground and a way to stand out.

Customer intimacy Pipedrive Notes interface

Instead of the usual “How’s business?”, the rep asks, “Been anywhere interesting this month?”.

That one small CRM-informed personalization instantly makes the conversation more intimate. It shows the rep’s attentiveness and tells the lead they’re more than just another customer.

It builds trust, forging a smoother path to honest business discussion.

Pipedrive in action: SaaS company Falcon uses Pipedrive’s custom fields to collect detailed customer data. Its sales and success teams use this information to personalize interactions. Marketing Operations Manager May Laursen said, “[Pipedrive] brings us closer to the customers, understanding their needs and mapping their relationship with us.”

2. Build trust through transparency and communication

Make honesty your default approach.

Use sales conversations, marketing content and every customer interaction to communicate key information clearly.

Customers should quickly find and understand:

  • Product capabilities

  • Pricing and add-on costs

  • Policies (e.g., usage, security measures)

  • Service levels (e.g., response times, support availability)

FreshBooks’ pricing page is a great example. It details each plan’s inclusions and add-on costs and “Information” buttons provide more details.

Customer intimacy Freshbooks pricing

Letting people know what to expect builds trust, which translates to more sales and loyalty.

A 2025 Edelman survey shows trust influences buying decisions as much as cost and quality. 88% of respondents marked it either important or a dealbreaker.

Customer intimacy Trust Barometer graph

Qualtrics also found that “consistently delivering on promises” was one of the top 10 drivers of brand trust. The most successful companies do this to keep customers close.

When mistakes happen, own them.

Inform customers of delays before they raise an issue. Apologize for the downtime and say how you’ll fix it.

Research reveals that customers who complain want more than refunds. They want to feel heard, respected and taken seriously.

Prevent failure with your guide to handling tricky sales situations

Learn how to prevent and overcome failure for your sales team. This 18-page ebook will help you develop plans for hiring, firing, and managing a crisis.

3. Gather and act on customer feedback

Listen carefully to what customers say and show that their voices matter by acting on the input.

With so many ways to collect feedback proactively, waiting for minor issues to become customer complaints and quietly turn into mass unsubscribes makes little sense.

Here are some ideas:

  • Send simple net promoter score (NPS) surveys after major transactions. The standardized results (usually a scale of 0–10) will help you spot trends over time.

  • Set up regular check-in calls with key customers to discuss their experiences. Proactively making people feel heard builds trust.

  • Ask directly for insights via email. Segment your best or latest customers to get the most relevant data.

Invite customers to talk face-to-face, on a call or over video for extra intimacy. Face-to-face communication conveys richer social cues and builds stronger bonds than digital messages alone.

For example, Miro conducts research sessions in the form of 45-minute interviews, arranged via email:

Customer intimacy Miro feedback email

Here’s why building a customer advisory board of sorts works:

  • There’s a financial incentive. Recipients can see that Miro values their time (which is appropriate for an AI productivity tool).

  • The request is explicit. Miro explains the timing, format and conversation topic so people know what to expect.

  • Participation is easy. The customer can choose a convenient time slot by clicking or replying. No forms or calls needed.

The exchange doesn’t stop there.

After customers share feedback through interviews, Miro shows them how their input creates change. It publishes content like “3 things we heard from our Miro learners this year”, writing:

“We’ve heard powerful feedback that tells us where you’re focusing attention on your own development, and what work problems you’re experiencing right now.

“As we combed through the feedback from every learner, we noticed some themes in your questions that will help us develop new courses, badges, videos, and more in the upcoming year.”

Updates close the feedback loop. They make customers feel like partners in the brand’s story, empowered to shape their own experience.

You can also use in-person conversations, social media, webinars and email newsletters to show how customers’ insights guide your decision-making.

4. Empower frontline teams to create human connections

Give frontline staff the tools and freedom to strengthen relationships in every interaction.

Encourage the team to learn about individual customers, t. This will help them forge emotional connections and create more intimate customer experiences.

We’ve discussed how logging personal context in a CRM helps teams build rapport. Here are other ways to empower staff:

Customer intimacy tactic

How to use it

Teach empathic communication

Train customer support agents to listen carefully, acknowledge frustrations and show understanding before offering solutions.

Give autonomy

Let reps solve minor problems (e.g., refunds and goodwill credits) without a manager’s approval. It shows trust in your staff while solving customers’ issues faster.

Share customer intimacy examples

Use internal communications to share stories of team members who go above and beyond to achieve customer satisfaction. Their efforts should inspire others to do the same.

Use CRM integrations

Connect your CRM with help desk, live chat and email marketing software so staff have full context in real time. This integration makes it easier for teams to deliver personalized experiences.

Pipedrive integrates with many tools that sales, support and marketing teams use to nurture relationships. These include​​ Slack, Zoom, Google Meet, Fireflies.ai and many more.

Once connected, these systems can share data to give users a more detailed view of the people they talk to.

For example, Fireflies.ai pulls meeting notes straight into contact profiles on Pipedrive.

Reps can catch up on previous discussions before starting the next, so the customer doesn’t need to repeat any information.

Here’s what the integration looks like:

Customer intimacy Pipedrive Fireflies.ai integration

Integrations like these are a form of automation. Removing manual data entry and app-switching gives teams more time and context to focus on customer intimacy.

That time gain is good for productivity and morale.

It’s why 92% of the sales and marketing pros we spoke to use at least one form of automation and they’re happier on average than those who do everything manually.

Want to Learn How to Influence Your Prospect’s Buying Decisions?

Get inside the head of your customers and take advantage of consumer psychology with this Psychological Selling Guide.

5. Balance automation with authentic human connection

Over-relying on automation will make your service feel more robotic than intimate.

Find the right balance to consistently address pain points on a personal level and build long-term relationships.

As a general rule, aim to automate repetitive, low-value tasks and let people handle situations that need empathy and context.

For example:

  • Welcome emails are a regular occurrence and rarely change. Automate them with email marketing software, like Campaigns.

  • A customer complaint is more nuanced. It needs the attention of an agent who understands the situation and has problem-solving skills.

Here are some more examples of where automation will and won’t help customer intimacy:

Leave it to automation (productivity gains)

Let humans handle it (customer engagement)

Updating CRM records and meeting notes

Dealing with complaints and sensitive issues

Scheduling reminders and follow-ups

Interviewing loyal customers about user experiences

Answering basic inquiries via chatbot

Empathic communication in support conversations

Lead scoring and prioritization

Building personal relationships in sales calls

Transactional emails (e.g., confirmations, renewals)

Explaining policies or complex solutions

Gartner predicts that AI will handle 80% of customer service cases by 2029. However, another study shows that 75% of customers prefer talking to humans over automated systems.

Meeting those customers’ expectations will be a strong differentiator.

Recommended reading

https://www-cms.pipedriveassets.com/Marketing-Automation-Strategy.jpg

Create an effective marketing automation strategy and improve your ROI

Customer intimacy in business: examples from B2B and B2C

Seeing customer intimacy in action makes this seemingly abstract idea more tangible.

Here are two examples of businesses that build close relationships throughout the customer journey.

1. B2B SaaS: TrekkSoft

Swiss software company TrekkSoft partnered with Pipedrive to deliver personalized experiences at scale through segmentation and automation.

Customer intimacy TrekkSoft homepage

The team sent tailored campaigns to different customer groups, such as sightseeing tour companies and adventure companies. This approach maintained intimacy while boosting efficiency.

Productivity quadrupled, leads increased and sign-ups grew.

Key takeaway: Automation builds customer loyalty when it delivers more relevant, human-centered experiences.

2. B2C retail: ThirdLove

Lingerie retailer ThirdLove’s Fitting Room tool asks shoppers about past fits, preferred hook settings and brand comfort. Then it recommends the right bra sizes and styles using machine learning algorithms.

Customer intimacy ThirdLove fitting tool

As the company collects fit and feedback data, its recommendations improve. The practical tool becomes a thoughtful, ongoing conversation with each customer. It feels intimate, even without human interaction.

Key takeaway: The more accurate and up-to-date customer data you have, the easier it is to meet buyers’ needs. Organize yours in a CRM system to keep up with trends.

How to measure customer intimacy: 5 key metrics

A few simple sales metrics make customer intimacy clear. Use the following markers to track loyalty, retention and advocacy after implementing your strategy.

Customer intimacy metric

What it means and where to track it

Customer retention rate

How many customers stick with you over time, through repeat purchases or subscription renewals

Where to look: CRM reports, subscription or repeat purchase data

Customer lifetime value (CLV)

The revenue one customer generates over their relationship with your business

Where to look: CRM or accounting software

Net Promoter Score (NPS)

How likely customers are to recommend you to others (measured on a 0-10 scale)

Where to look: Post-purchase surveys, NPS tools

Upsell and cross-sell revenue

Sales growth from existing customers (including upgrades, accessories and recommendations)

Where to look: CRM sales dashboards, deal reports

Customer feedback response rate and sentiment

The number of survey responses, reviews or comments and whether they’re positive or negative

Where to look: Feedback tools (including Pipedrive integrations), review platforms and social media monitoring

These metrics help you tie actions to outcomes. Use them to build on what works and avoid what doesn’t, then squeeze more value from your sales and marketing budgets.

Recommended reading

https://www-cms.pipedriveassets.com/SaaS-marketing-metrics.png

SaaS marketing metrics that matter

Final thoughts

Competing on price when entering a new market or growing your startup may seem appealing.

But low prices are easy to copy. They weaken your value and rarely create lasting loyalty.

Customer intimacy offers a much stronger, more sustainable advantage.

Focus on human connections. You’ll create experiences customers remember and recommend for the right reasons. Lower churn and more sales referrals will follow, showing that putting individual buyers first is one of the most reliable ways to lead a market.

Pipedrive’s contact management features help you stay close to the people who matter most. Start your free 14-day trial today and see the difference.

Sales Blitz Ideas & Guide

Software Stack Editor · September 9, 2025 ·

GC

Gabriela CampagnaSEO Content Writer, Pipedrive

When pipeline momentum slows, a focused sprint can reset the pace. A sales blitz concentrates your team on one segment, one offer and one conversion goal for a short, defined window. The payoff is clarity: tighter messaging, faster feedback on what resonates and a surge of near term meetings that refresh the pipeline.

A well run sales blitz improves operating rhythm with daily coaching, clear ownership and disciplined follow-through.

A sales blitz is a coordinated, time-boxed campaign with prepared lists, reserved calendar capacity and consistent touch patterns across email, calls and social. Run it as a two week experiment pairing high activity with clear intent.

Measure the signal you generate: which segments respond, which messages convert and where to invest next. Your customer relationship management (CRM) software should centralize targeting, activities and reporting so the team moves quickly without losing context.

Key takeaways

  • Time-box the blitz to 7–14 days and focus on one segment, one offer and one conversion goal to keep execution sharp.

  • Prep the foundations before day one: clean lists, clear messaging, booked calendars and SLAs, so reps can start immediately.

  • Coach daily, run a midpoint review and move the best-performing message to the top of the sequence to lift results fast.

  • Track inputs and outcomes together, then cohort by segment and message to separate useful signals from raw activity.

  • Find out how Pipedrive can centralize targeting, activities, automation and reporting so the sprint stays organized and measurable with a 14 day free trial.

What is a sales blitz?

A sales blitz is a short, time boxed campaign— usually 7 to 14 days. A cross-functional team runs a coordinated outreach plan to a defined audience with one outcome in mind, for example, booked sales meetings, trial starts or reactivations. Scope is narrow to increase impact: one segment, one offer, one sequence and one follow-up service-level agreement (SLA).

Effective sales blitzes share the same setup. Lock the target list before day one using clear criteria. Lead with a problem or outcome the segment cares about. Reserve calendar time so interest can turn into meetings without delay. Set daily activity targets and hold quick coaching huddles to keep execution consistent.

Adjust as you go. Use a midpoint review to refine subject lines, openers and call frameworks. Measure both inputs and outcomes: touch adherence, connect rate, meeting rate, opportunities created and pipeline added and watch quality signals like positive reply intent and early stage movement.

A sales blitz doesn’t mean that you do a little bit of everything everywhere. It means that you do a lot of something in a very tight, narrow area.

– Mark Hunter, The Sales Hunter blog

How to plan a sales blitz

Good sales blitzes are won before day one. Use this planning checklist to remove friction, align ownership and make sure sales calendars, data and messaging are ready so the team can focus on execution.

  1. Assign ownership and cadence. Name a sales blitz lead, set a daily stand-up and a short end-of-day recap so decisions and changes roll out cleanly.

  2. Confirm capacity and routing. Block calendars for discovery calls, define who takes meetings and set routing rules by region or segment.

  3. Clean the data. Remove do-not-contact records, dedupe, verify domains and tag the sales blitz cohort so results are easy to read later.

  4. Define the offer and outcome. State the single action you want and why it matters to this audience right now.

  5. Write a concise sequence. Limit to a few touches across email, calls and social; keep the ask specific and easy to accept.

  6. Prepare a lightweight enablement kit. One page with audience, value, talk track, common sales objections and a short case or demo link.

  7. Set targets and SLAs. Daily touch goals by role, a response window for inbound replies and a rule for moving from prospecting to meeting prep.

  8. Pre-plan the midpoint pivot. Decide which numbers trigger changes (for example, if positive replies are low, test a new opener and if replies are high but meetings are low, tighten the ask or fix scheduling).

  9. Close the loop paths. Map outcomes, booked, qualified no, not now, no response and set short nurture paths so the sales blitz feeds the ongoing pipeline.

Recommended reading

https://www-cms.pipedriveassets.com/Sales-Enablement.png

Sales enablement: definition, benefits and how-to guide

Sales blitz ideas that convert

Reactivation plays work well when you can reference change. Reach out to previously engaged prospects or closed-lost opportunities with a specific update, such as, a new capability, a pricing change, an integration or a case study in their industry.

Expansion plays target active customers with clear signals. Usage patterns, new stakeholders or upcoming initiatives can anchor a focused ask for a quick planning call. The sales goal is a defined next step tied to a value outcome. According to Farris, Bendle, Pfeifer and Reibstein in Marketing Metrics, the probability of selling to an existing customer is 60–70% vs. 5–20% for new prospects, so plan blitzes that expand existing accounts.

A sales blitz is either a proactive initiative or a reactive response to a lack of prospecting discipline.

— Anthony Iannarino, The Sales Blog

Event-triggered plays build on momentum that already exists. Follow up with webinar attendees, recent booth scans, funding announcements or leadership hires with a short message that connects the event to a relevant outcome and an easy path to schedule.

Partner and referral days compress warm introductions. Spend a single day co-selling with one partner, exchanging intros for a narrow ideal customer profile (ICP). Keep the ask small and the scheduling friction low.

Short video messages and point-of-view posts can lift response in certain segments. One minute of specific value, a quick teardown, a sales metric you can move, a pattern you’re seeing often beats another paragraph of copy, especially late in the week.

Execution playbook: a day-by-day cadence

Use this cadence to keep the blitz focused, measurable and easy to coach.

  • Days 0–1: Finalize the list, sequence and enablement. Confirm calendar holds and SLAs, load templates, set activity targets, brief the team and do a quick role play. By the end of day 1, you should be ready to send or dial.

  • Days 2–5: Execute with quality and coach live. Run short huddles twice a day to review reply quality, call outcomes and objections. Adjust subject lines, openers and talk tracks based on data. Keep logging consistent so the midpoint review is useful.

  • Days 6–7 (midpoint): Cut what doesn’t work and promote what does. Move the best message to position one. Refresh the list only if you’ve exhausted quality targets or found a better filter. Reconfirm calendar capacity for the push phase.

  • Days 8–12: Shift to conversion. Prioritize follow-ups, handoffs and no-shows. Tighten message length and the ask. If responses spike, reallocate time from sales prospecting to meeting conversion and preparation.

  • Days 13–14: Close loops. Convert late replies, clean data and route open opportunities to owners with clear notes, next steps and dates. Capture learnings while they’re fresh.

Note: According to CSO Insights’ 2019 Sales Enablement Study, teams with dynamic sales coaching averaged a 55.2% win rate vs 41.8% with random coaching, 19% above the study average and 32% above random, which supports daily huddles and a midpoint review during the sales blitz.

Recommended reading

https://www-cms.pipedriveassets.com/blog-assets/sales-tactics.png

11 sales tactics proven to fill your pipeline and close deals

Sales blitz metrics that matter and how to read them

Use this lightweight table during the sales blitz.

Metric

Description

Cadence

Touches per rep

Outbound actions completed vs target

Daily

Sequence adherence

Steps completed on time and in order

Daily

Connect rate

Live conversations as a share of dials

Daily

Time to first response

Minutes from inbound reply to first action

Same day (SLA)

Positive reply rate

Replies showing clear interest

Daily

Booked-meeting rate

Contacts that schedule from outreach

Daily

Meetings set

Count of first meetings scheduled

Daily

Opportunities created

Qualified deals opened from the blitz cohort

Weekly

Pipeline added

Total value of opportunities from the blitz

Weekly

Stage progression

Opportunities moving to the next stage within 14–30 days

14–30 days

No-show rate

Share of first meetings missed

Weekly

Win-back/reactivations

Stalled or closed-lost re-engaged

Weekly

How Pipedrive helps you run a sales blitz

Pipedrive brings structure and visibility to a sales blitz so the team can move fast without losing context. It keeps the list, offer and goal in one place, which makes coordination simple and execution consistent.

With contact management, custom fields and filters, you can define a precise segment and save it as a shared view. Tag the blitz cohort to track outcomes cleanly across the campaign.

Execution stays on track with activities, due dates and templates. Connect calling and email so outcomes are logged the same way every time and reps always know the next action. Sales automation reduces lag. Create follow-up tasks when a call is completed or a reply arrives, advance stages when a form or booking fires and nudge owners when SLAs are at risk.

Sales dashboards give real-time signals. See daily touches, positive replies, meetings set, opportunities created and sales pipeline added for the blitz cohort. Compare message versions and reps to decide what to promote at the midpoint review.

After the sprint, keep momentum. Convert winning messages and filters into a reusable play, route open opportunities with clear next steps and schedule a 30-day follow-up report to. Pipedrive gives you one place to run the blitz, read the results and turn what worked into a repeatable playbook.

FAQ

  • A short, time-boxed campaign where a team focuses on one segment with a single offer and a coordinated sequence to drive a specific outcome, usually over 7–14 days.

  • Most teams see the best signal in two weeks or less. Shorter windows keep focus high and make iteration faster.

  • Plan a concise multi-channel sequence across email, calls and social, then adjust mid-point based on reply quality and meeting rate. Quality beats sheer volume.

  • Reactivation of stalled opportunities, customer expansion signals, event triggers, partner co-selling days and short value videos often convert well when the message is specific.

  • It centralizes the cohort, sequences activities, automates follow-ups on outcomes and makes results easy to read so you can coach and iterate in real time.

Final thoughts

A good sales blitz is a focused experiment. It trades breadth for depth, forces decisions about audience and offer, creating a feedback loop you can’t get from business-as-usual outreach. The near-term wins are useful, more meetings, cleaner pipeline, but the lasting value is operational.

Treat each sales blitz as versioned work. Capture what to keep, what to kill and what to iterate. Over time you’ll build a library of plays, better data discipline and a faster path from idea to pipeline.

Building Rapport with Clients | How To Build Client Rapport

Software Stack Editor · September 9, 2025 ·

Sales is no longer just about closing, it’s about connecting with the buyers. With more channels, higher expectations and automated outreach, genuine client rapport is a clear competitive advantage. The client rapport guide turns those principles into repeatable actions, such as capturing client context, scheduling timely follow-ups and keeping every touchpoint relevant.

When rapport is strong, conversations become more open, objections soften and opportunities to add value become clearer. Whether you’re managing new leads or nurturing long-term accounts, building rapport with clients is a core skill that consistently drives long-term revenue.

Establishing rapport with clients comes down to relevance, consistency and timing. The stronger the connection, the more likely they are to stick with you, refer others and come back when they’re ready to buy again.

Key takeaways for client rapport

  • Rapport is earned through relevant, reliable communication that builds trust over time.

  • Establish it early by listening first, echoing objectives in the client’s language and confirming a small next step.

  • Maintain it with disciplined follow-through: capture decisions, assign owners with due dates and keep a steady cadence between deals.

  • Prevent breakdowns by avoiding generic outreach, slow responses and unstructured handoffs that make clients start over.

  • Pipedrive helps sales and account teams build stronger relationships by centralizing touchpoints, automating follow-ups and keeping client context visible at every stage. Try Pipedrive free for 14 days.

What is client rapport and why does it matter in sales?

Client rapport is the trust and connection that forms when your communication feels relevant, consistent and genuinely focused on the client’s needs. It’s not about being friendly, it’s about being reliable, informed and easy to work with.

Strong rapport leads to candid sales discovery, cleaner handoffs and faster decisions. When clients feel understood, they respond sooner, share useful context and are more likely to renew or expand.

Rapport is earned through consistent behavior. Listen carefully, reflect priorities back and follow through on commitments. Capture preferences and next steps in your customer relationship management (CRM) software, schedule timely reminders and keep messages aligned across your team. Over time, those signals compound into a dependable relationship.

Rapport is the ability to enter someone else’s world, to make him feel that you understand them, that you have a strong common bond.

– Tony Robbins, Unlimited Power (Simon & Schuster)

How to build rapport with clients at every stage

Client rapport grows across stages of the relationship. Early conversations establish credibility, discovery builds alignment and the post-sale phase proves reliability.

In early outreach, lead with relevance. Do the research, mirror your contact’s language and make the first commitment easy to accept. In your CRM, add context to the lead, record the outreach trigger and create a follow-up activity before you end the call. Use workflow automation to auto-tag source data and generate tasks and subtasks when a call is logged or a sales stage changes.

During discovery, make it easy to be honest. Ask precise sales discovery questions, summarize what you heard and confirm priorities, constraints and decision criteria. Close each sales conversation with an agreed action, owner and date, then follow through.

After the sale, rapport becomes about reliability. Send concise recap notes, share useful updates and flag risks early. Maintain a steady check-in rhythm, celebrate small wins and close loops on every commitment.

According to research published in Harvard Business Review by Matthew Dixon, Karen Freeman and Nicholas Toman, customers who report low effort are 94% likely to repurchase and 88% say they’ll increase spending, while high-effort experiences drive 81% to spread negative word of mouth, so make every interaction easy.

Reliable sales communication between deals is what turns rapport into a long-term partnership.

Recommended reading

https://www-cms.pipedriveassets.com/Sales-Motion.png

How to create a winning sales motion for your business

What makes client rapport difficult to maintain?

Client rapport weakens without reinforcement. Failure is usually gradual: missed sales follow-ups, unclear recaps and poor handoffs accumulate until clients disengage.

It’s not your customer’s job to remember you. It is your obligation and responsibility to make sure they don’t have the chance to forget you.

– Patricia Fripp, Sales Presentation and Online Learning Expert

As teams and businesses scale, context can get lost. The person who built the relationship might not be the one managing it. Without clear notes or shared history, communication becomes generic. That shift from personal to transactional is where rapport breaks down.

Consistency is the biggest challenge, busy teams forget to log details and follow-ups slip. The client feels like they’re starting over every time. Without a clear sales process and the right sales software to support it, even strong rapport is hard to keep.

Recommended reading

https://www-cms.pipedriveassets.com/discovery_call.png

Discovery call questions that will qualify leads and build relationships

Best practices for developing client rapport

Developing rapport with clients requires consistency, context and care. Here are some of the most effective ways to build and maintain strong client relationships:

  1. Listen first, talk second. Active listening builds trust faster than any sales pitch. Let the client speak, clarify what they say and reflect their needs back in your responses.

  2. Use their language, not your jargon. Mirror how your client talks about their challenges. It shows you understand their world and aren’t just dropping sales terms into the conversation.

  3. Keep your promises. Even small missed follow-ups can break trust. If you say you’ll send something, do it. Reliability is the backbone of client rapport.

  4. Document personal details. Remembering names, time zones, goals and key performance indicators (KPIs) goes a long way. Use your CRM to log these details and personalize future touchpoints.

  5. Stay relevant between meetings. Don’t disappear between sales calls. Share a useful resource, quick update or industry tip to stay top of mind without being intrusive.

  6. Make handovers feel seamless. If another team member takes over the relationship, ensure they’re briefed. A smooth transition shows the whole team cares, not just one sales rep.

  7. Adapt to their communication style. Some clients prefer calls, others want email recaps. Meet them where they’re most comfortable and you’ll make every interaction easier.

Which rapport tips are most effective for retaining customers

Retention starts with trust, which is often built through small, consistent actions. The most effective rapport-building habits are the ones that make clients feel seen, supported and easy to work with over time.

Instead of waiting for a renewal to re-engage, create a rhythm of value. Let them know you’re paying attention, even when there’s nothing to sell. Ongoing connection makes it easier to stay top of mind and harder to replace.

Practical ways to strengthen client rapport and improve retention:

  • Establish response expectations and meet them

  • Align every update with the client’s business goals and metrics

  • Share proactive, relevant updates and insights

  • Maintain a predictable cadence between deals

  • Centralize client context to ensure seamless handoffs

When the relationship feels collaborative, clients are more likely to respond, refer and renew.

How Pipedrive helps you build and maintain client rapport

Pipedrive helps strengthen client rapport by bringing structure and visibility to your entire relationship workflow – from first outreach to long-term account management.

With built-in contact management and sales automation, teams can follow up consistently, stay on top of client preferences and reduce the manual gaps that weaken trust.

Customizable sales pipelines give sales and account teams a clear view of every interaction, making it easier to maintain momentum across calls, emails and follow-ups. You can track where each client is in the process and what they care about.

Syncing CRM data with your outreach tools like Pipedrive ensures that every message is timely and relevant. You can log important details, schedule check-ins and create reminders based on individual client needs, helping you stay proactive.

When clients go quiet or show signs of disengagement, automation rules can trigger follow-ups, assign tasks or prompt personalized check-ins. With centralized sales reporting, your team gets a clear view of relationship health and the tools to improve it over time.

FAQ

  • Lead with listening, then confirm their objectives, constraints and next step in their words. Keep the first commitment small and deliver on it quickly.

  • Both benefit, but in B2B the stakes are higher: longer sales cycles, more stakeholders and higher switching costs make client rapport a key driver of renewal and expansion.

  • There’s no fixed timeline. Consistency and relevance accelerate trust, shown by faster replies, richer context and smoother decisions.

  • Yes. CRMs like Pipedrive centralize context, track commitments and schedule timely follow-ups so every interaction reflects the client’s goals and history.

  • There’s no fixed timeline. Consistent, relevant communication accelerates trust, you’ll see it in faster replies, deeper context sharing and smoother decisions.

Final thoughts

Client rapport is a powerful but often underestimated driver of long-term sales success. When trust is strong, conversations flow more naturally, objections are easier to manage and clients are more likely to stay, refer and expand.

Rapport doesn’t build itself, it takes consistent effort, attention to detail and tools that keep your team aligned and responsive.

Listening actively, following through on promises and staying relevant between touchpoints, you can create lasting client relationships that lead to higher retention and repeat business.

Try Pipedrive free for 14 days.

  • « Go to Previous Page
  • Page 1
  • Interim pages omitted …
  • Page 4
  • Page 5
  • Page 6
  • Page 7
  • Page 8
  • Interim pages omitted …
  • Page 97
  • Go to Next Page »

Get your Software Stack together. softwarestack.tech

Software Stack

© 2024–2026 - Software Stack is a trading name of SouthwestCIO Limited ac ompany registered in England & Wales 11319049

  • Knowledgebase
  • Home
  • About Us
  • Contact Us